Q2 2025 | Market Update
Despite ongoing concerns about tariffs and geopolitical risks, markets rebounded by the end of Q2, with key indexes near or above all-time highs.
Highlights
- With ongoing tariff uncertainty and geopolitical tensions, heightened volatility for both equities and bonds is likely to continue.
- Inflation concerns weigh on central banks, which continue to closely watch data on the economies’ health to cue interest rate decisions.
- The trend of broadening outside of the U.S. with active management remains key. We maintain diversified exposure between stocks and bonds and across geographies.
Tariff reprieve fuels market recovery
The second quarter (Q2) began with a brisk sell off following Liberation Day (April 2), when the Trump administration announced punitive tariffs across the globe. The sell-off in both stocks and bonds led Trump to implement a 90-day pause in tariffs, allowing time for negotiations. Markets rallied with relief and continued to climb that wall of worry around tariffs and geopolitical risks. At quarter end markets had rebounded, with key indexes above or near all-time highs.
Many key indexes took off in Q2 following declines early in the month. The S&P 500 Index surged 25% from April lows, led by technology and AI stocks, to finish off the quarter up 7%1 (USD) year to date as of June 30, 2025. Positive sentiment was also driven by strong technology earnings, and the “One Big Beautiful Bill” (OBBB) Act in the U.S., which in the short term, reduces fiscal policy uncertainty and offers benefits such as tax cuts and deregulation.
Canadian equities also gained. The S&P/TSX Composite Index rose 9.3%1 in Q2 from last quarter to hit a new all-time high powered by strong corporate earnings and easing trade tensions. Top sectors were information technology, materials and financials. Fueled by a mix of macroeconomic shifts and rotation into global equities, Europe and emerging equities also performed well in the three-month period.
Graph 1: Equity markets rebound after steep sell-off in early April
Total return, indexed to 0 as of June 30, 2024
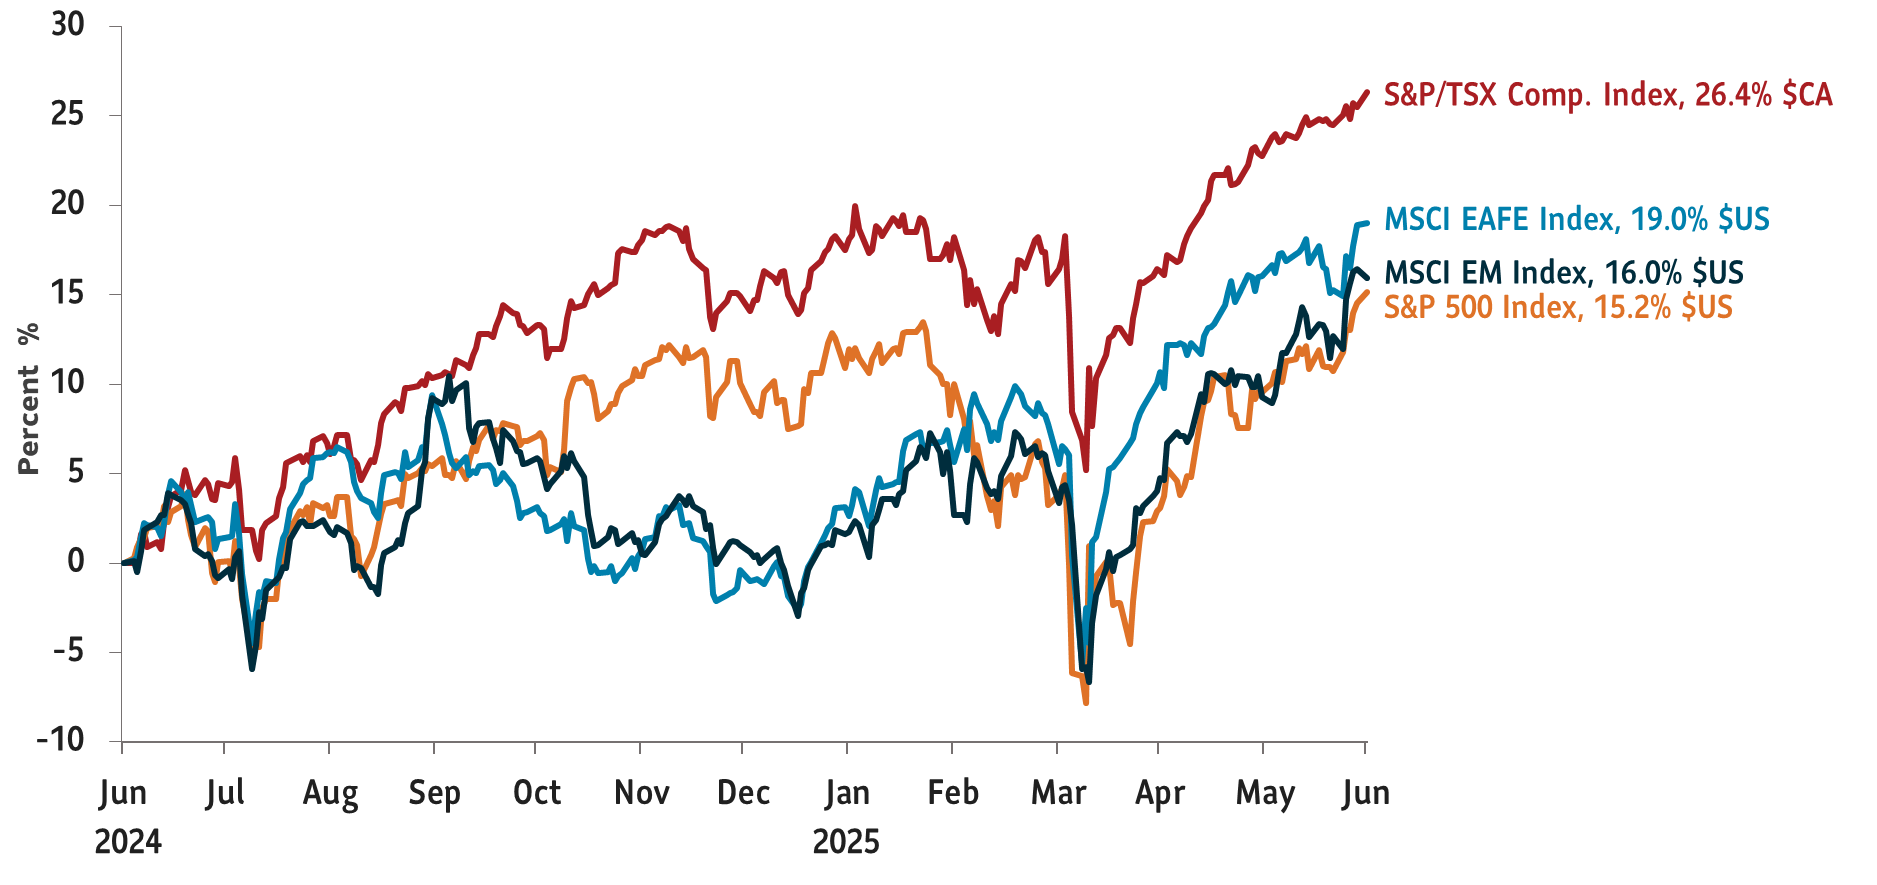
Source: Bloomberg data as of June 30, 2025.
Overall bond yields in the U.S. and Canada remained strong in Q2. The benchmark 10-year U.S. Treasury yield ended the quarter with a yield of 4.23% up a mere three basis points (bps) from last quarter.1 Concerns about the high U.S. fiscal debt and potentially fewer rate cuts by the U.S. Federal Reserve (Fed) than previously anticipated, kept longer-term yields elevated. In Canada, 10-year yields rose 32 bps from last quarter1 – pushed up by inflation worries and expectations that interest rates may not see any relief for a while in Canada, despite back-to-back GDP contractions.
Chart 2: Bond yields remain strong - buoyed by inflation & fiscal debt worries
U.S. and Canada 10-year bond yields
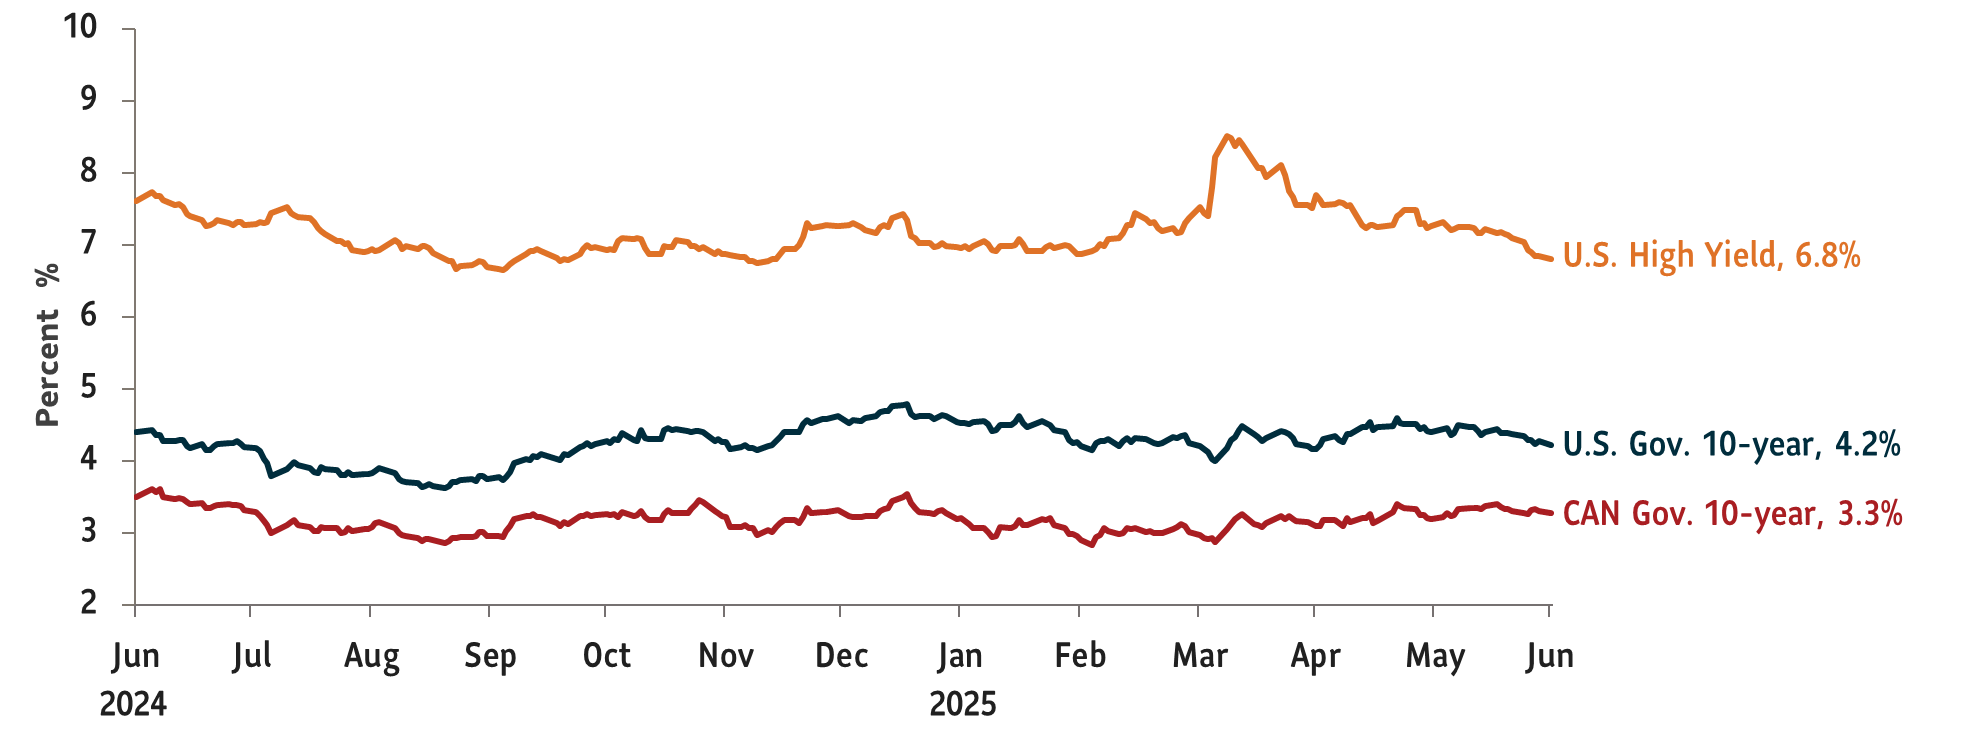
Source: Bloomberg data as of June 30, 2025.
One of the most notable moving assets in Q2 was the U.S. dollar. On a broad-weighted basis against other key currencies, it’s now lost about 10% year to date.2 This highlights that policy uncertainty in the U.S. has spurred global investors to perhaps rethink their positioning and start to broaden their investments across the globe. This has been beneficial to well diversified global portfolios like our Granite portfolios.
Looking to the second half of the year, we are watching for the economic impact of the OBBB, which will lower taxes for U.S. companies but also includes spending cuts. We should have more clarity on tariff rates, including the potential impact on earnings and inflation. The Fed may start to cut rates, which would be a positive for markets.
Key tactical changes
- Remain tactically overweight in gold: Gold, considered a safe haven asset, is up about 25% this year in Canadian dollar terms.3 Factors driving it higher are likely ongoing economic uncertainty, central bank buying and geopolitical tensions.
- Reinitiated tactical overweight position in oil: Driven by market indicators, attractive pricing, and reduced oil inventories.
1 Source: Bloomberg data as of June 30, 2025.
2 Source: Bloomberg: Trade weighted USD Index (DXY) January 1 to June 30, 2025.
3Source: Bloomberg: CGL, iShares Gold Bullion Canadian ETF, as of June 30, 2025.
Views expressed regarding a particular company, security, industry or market sector should not be considered an indication of trading intent of any mutual funds managed by SLGI Asset Management Inc. These views are subject to change and are not to be considered as investment advice nor should they be considered a recommendation to buy or sell. This commentary is provided for information purposes only and is not intended to provide specific individual financial, investment, tax or legal advice. Information contained in this commentary has been compiled from sources believed to be reliable, but no representation or warranty, express or implied, is made with respect to its timeliness or accuracy.
This commentary may contain forward-looking statements about the economy and markets, their future performance, strategies or prospects or events and are subject to uncertainties that could cause actual results to differ materially from those expressed or implied in such statements. Forward-looking statements are not guarantees of future performance and are speculative in nature and cannot be relied upon.