Why Fixed Income, Why Now: A Strategic Perspective
This article explores the current market dynamics, potential risks, and opportunities that make fixed income an attractive consideration for investors seeking to optimize their portfolios in the current environment.

In today's complex financial landscape, investors face a critical juncture. With global markets experiencing significant appreciation since 2022 and potential economic headwinds on the horizon, the case for reassessing portfolio allocations—particularly towards fixed income—has become increasingly strong. This article explores the current market dynamics, potential risks, and opportunities that make fixed income an attractive consideration for investors seeking to optimize their portfolios in the current environment.
The Equity Market Landscape: Signs of Overvaluation
Historical P/E Ratios and Market Performance
The broad U.S. equity market benchmark (represented by the S&P 500) has seen its forward price-to-earnings (P/E) multiple reach close to a decade high of 21.5 at the end of April 2026 (Source: S&P Global forward P/E). The price to earnings multiple is a ratio of a company or index, market price divided by its earnings per share. It is used to determine the relative value of a company’s shares or valuation of a stock market index by comparing price to earnings.
S&P 500 P/E-Ratios (12m fwd) & Subsequent Returns (5 years)
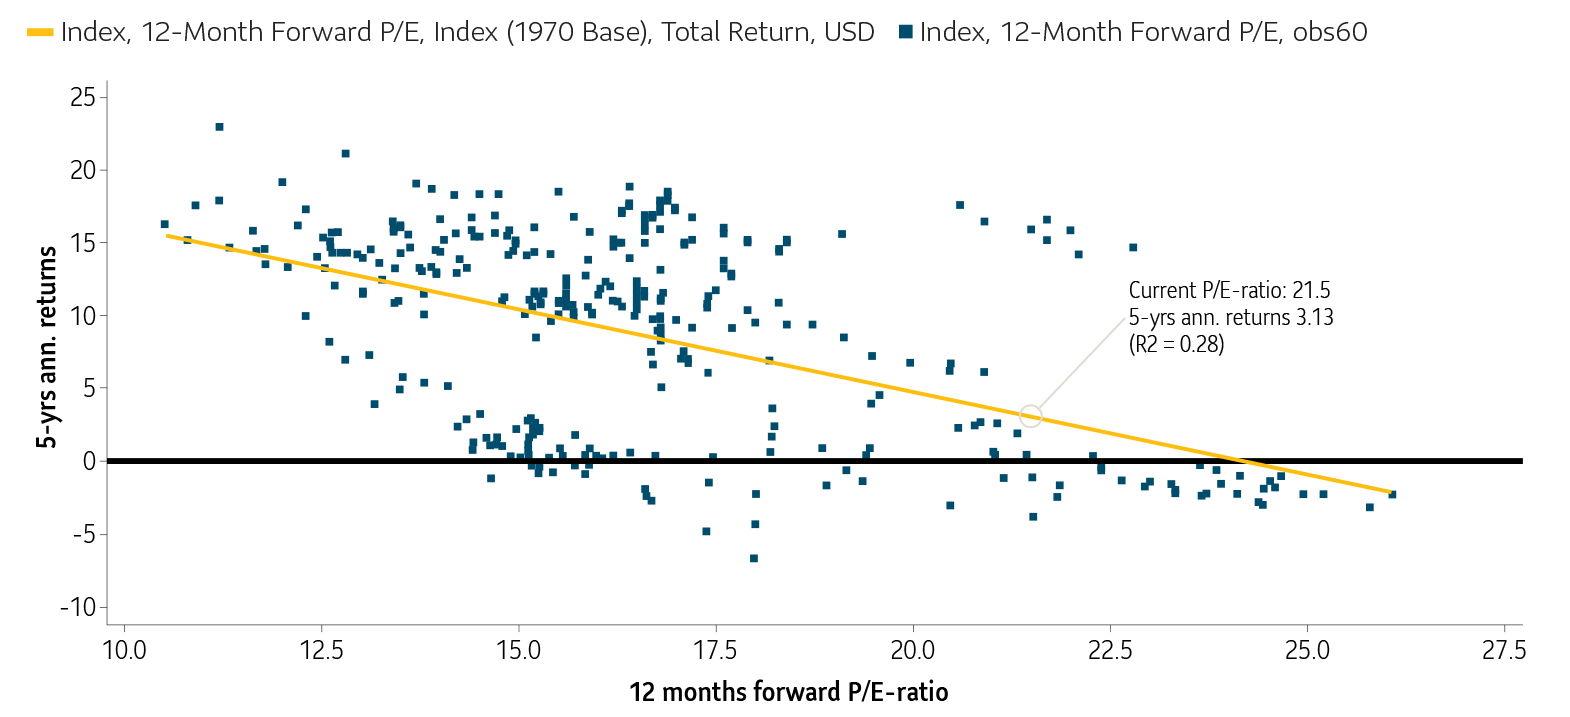
To put this in perspective, such elevated levels have only been observed two times since 1985. This historical context raises questions about current market valuations, potential risks and return potential over the next 5 years.
Earnings vs. Index Growth Divergence
Since the end of 2019: - S&P 500 earnings per share (EPS) increased by 68.52% (8.4% annually) – while the S&P 500 index itself grew by 145.5% (15.4% annually) representing a 7% annual difference over the past 6 years1.
This divergence has driven the P/E ratio from 15x in 2019 to its recent high of over 21x in April1, suggesting a potential disconnect between fundamental earnings growth and market valuations. This fact could hint that the market is overvalued, with stock prices outpacing fundamental earnings growth.
Source: FactSet Earnings Insight, Yahoo Finance, Morningstar DirectTM.
Global Market Appreciation
The robust market performance since 2022 has been widespread: - U.S. markets: Up 97% - Global markets: Up 88% - Canadian markets: Up 93%.
Market Index |
Cumulative Return |
S&P 500 TR CAD |
97.62% |
MSCI ACWI NR CAD |
88.17% |
S&P/TSX Composite TR |
93.14% |
Source: Morningstar DirectTM from January 1, 2023 to April 30, 2026. Canadian markets represented by the S&P/TSX Composite Total Return Index, Global markets represented by MSCI All Country World Index in Canadian dollars and US markets represented by S&P 500 Total Return Index in Canadian dollars.
While these gains have been beneficial for investors, they also present a timely opportunity to reassess portfolio allocations and consider rebalancing strategies.
The Case for Fixed Income
1. Attractive Yields and Return Potential
Current yield levels for fixed income investments have risen significantly across several bond indices over the past five years, offering more attractive entry points for investors. Yield to worst (YTW) is used in the illustration below as it helps investors understand the "worst-case scenario" for their bond's yield, ensuring they know the lowest return they might receive provided there is no default of the bond.
Name |
YTW - Avg |
YTW - Avg |
Canadian Bond Index (represented by iShares Core Canadian Universe Bond ETF) |
1.21% |
3.74% |
Global Bond Index (represented by Vanguard Global Aggregate Bond ETF CADH) |
0.63% |
4.09% |
U.S. Bond Index (represented by iShares Core US Aggregate Bond ETF) |
1.04% |
4.60% |
Morningstar DirectTM December 1, 2020, to April 30, 2026.
Elevated yield levels serve as strong indicators of what professional investors refer to as “expected returns”. For example, the Vanguard Global Aggregate Bond ETF’s yield to worst of 4.09% points to an expected annualized return of 4.1% over the next five years – a significant increase from the 0.63% level observed just over five years ago.
As shown on Graph 1 illustrating the S&P 500 P/E ratios – when compared to U.S. equities, bonds present a strong value proposition. The S&P 500 forward P/E ratio of 21 suggests a five-year expected return of approximately 3%, keeping in mind that generally equities have higher risk compared to bonds.
2. Declining Bond Correlation with Equities
Correlation is a measure of how the prices of two or more assets move in relation to each other. It helps investors understand whether assets tend to move in the same direction (positive correlation), opposite directions (negative correlation), or have no relationship (no correlation). This helps build the case for diversification of portfolios.
Recent data shows a decreasing correlation between stocks and bonds, meaning there would be enhanced diversification benefits by including an allocation to fixed income:
- Canadian bonds: 0.63 correlation with Canadian equities (over the last 2 years)
- U.S. Bonds: 0.46 correlation with U.S. equities
- Global Bonds: 0.35 correlation with global equities
Correlation Matrix
Time Period: 2024-05-01 to 2026-04-30
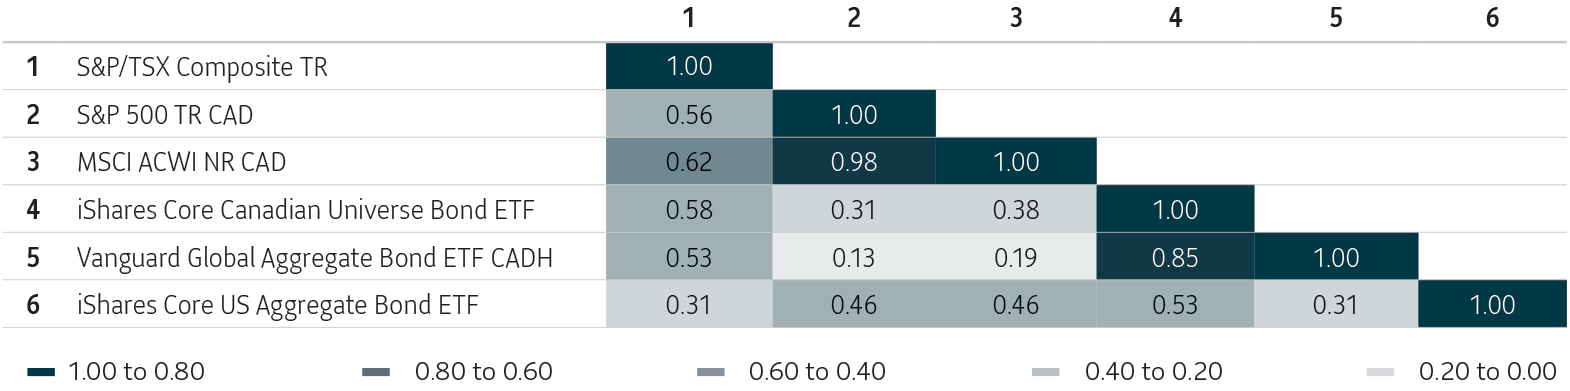
Source: Morningstar DirectTM return correlation over the last two years as of May 1, 2024. Canadian Bonds (represented by iShares Core Canadian Universe Bond ETF), Global Bonds (represented by Vanguard Global Aggregate Bond ETF CADH), US Bonds (represented by iShares Core US Aggregate Bond ETF), Canadian equities (represented by S&P/TSX Composite Index TR), US Equities (Represented by S&P 500 TR CAD), Global equities (represented MSCI ACWI NR CAD).
This reduced correlation underscores the potential for fixed income to provide some portfolio stability, especially during periods of equity market volatility.
3. Central Bank Policy
Both the Bank of Canada and the U.S. Federal Reserve have decided to keep rates steady.
The Bank of Canada (BoC) opted to hold its benchmark overnight lending rate steady at 2.25% during its last scheduled policy meeting on April 29, 2026. At its last scheduled policy meeting on April 29, 2026, the U.S. Federal Reserve voted to keep the federal funds rate unchanged at 3.50%. These policy shifts may create a more supportive environment for holders of fixed income investments, leading to potential capital appreciation in bond portfolios. There is also the potential that interest rates could increase due to inflation, driven by the price of oil rising because of the closure of the Strait of Hormuz. Active fixed income managers have several tools that can help navigate inflationary environments such as real return bonds, investment grade private fixed income, bank loans, and high yield bonds.
4. Recession Risk Mitigation
Economic indicators suggest an increased probability of recession in Canada.
Canada has successfully sidestepped a formal recession over the past year with Q1 2026 Gross Domestic Product (GDP) rebounding at a 1.7% annualized track. Economists from major institutions like the Bank of Canada and the IMF emphasize that the economy remains in a low-growth "slowdown" phase rather than a full contraction. Overall GDP is projected to expand by a modest 1.1% to 1.3% for the full year. Consensus estimates have Canadian recession probability at 30% -35%.
Source: Global News.
Strategic Considerations for Investors
- Portfolio Rebalancing: Given the significant appreciation in equity markets in recent years, investors may want to talk to their advisor to see if they should be re-allocating to fixed income to maintain their target asset allocation.
- Risk Management: The potential for economic headwinds and market volatility makes fixed income an important tool for managing overall portfolio risk.
- Income Generation: Higher yield levels offer improved income potential, which can be particularly attractive for investors seeking stable cash flows.
- Diversification Benefits: The reduced correlation between stocks and bonds enhances the diversification effect of fixed income within a portfolio.
- Tactical Opportunities: Active management in fixed income may provide opportunities to capitalize on market inefficiencies and generate alpha in a potentially challenging market environment.
Considerations for investors considering Active Fixed Income
Active fixed income strategies involve professional managers making decisions on duration, credit quality, sector allocation, and security selection rather than simply tracking an index. Here are the key reasons and considerations for why you might want to choose active management over passive:
Potential Advantage.
- Flexibility in Changing Markets
- Active managers can make adjustments as interest rates change. They can shorten or lengthen the time frame of the bonds they hold and shift positions along the interest rate curve. This flexibility helps manage risk and capture potential opportunities when markets are uncertain or rates move up or down.
- If the bond portfolio allows, these managers can shift between government bonds, corporate bonds, and other sectors to capture potential opportunities or reduce risk.
- Credit Selection and Risk Management
- Active managers analyze issuers (companies that have issued bonds) to avoid defaults and identify mispriced securities, which can add value beyond what an index provides.
- This is particularly important in corporate and high-yield bond markets where credit risk varies widely.
- Potential opportunity to add value beyond the market
- Active managers look for mispriced bonds and adjust positions when markets are unsettled. By making tactical choices and selecting individual securities, they can add value beyond what an index delivers—especially when bond prices vary widely.
- Risk Mitigation
- Active managers can respond quickly to macroeconomic changes, geopolitical risks, and liquidity challenges—something passive strategies cannot do.
Credit risk is the possibility that a borrower—such as a corporation or government—will fail to make interest payments or repay the principal on a bond or loan. In other words, it’s the risk of default, which can lead to a loss for investors.
Considerations and Trade-Offs
- Higher Fees
- Active strategies typically cost more than passive because they involve research and analysis and higher trading costs as managers try to outperform the market, so investors need to weigh potential performance against fees.
- Manager Skill Matters
- Success depends on the manager’s expertise and process. Not all active managers outperform consistently.
- Tracking Error
- Active portfolios may deviate significantly from benchmarks, which can lead to periods of underperformance when compared to those benchmarks.
Bottom Line
Active fixed income can make sense for investors who:
- Want professional oversight in volatile markets to help ensure quality of their bond portfolio.
- Value credit research and risk management.
- Are comfortable paying higher fees for potential added value.
However, active management does not guarantee outperformance. Investors should evaluate the manager’s track record, philosophy, and fit within their overall portfolio, while remembering that past performance is no indicator of future performance.
Conclusion
While equity markets have delivered strong returns in recent years, current valuations and economic indicators suggest that now may be an opportune time for investors to reassess their fixed income allocations. The combination of attractive yields, improved diversification benefits, and potential economic uncertainties make a strong case for increasing exposure to fixed income strategies.
However, it's important to note that market conditions can change rapidly, and individual investor circumstances vary. Investors should consult with their financial advisor to determine the most appropriate asset allocation strategy based on their specific goals, risk tolerance, and investment horizons.
By incorporating fixed income into their portfolios, investors may be able to enhance stability, generate income, and position themselves to navigate the evolving market landscape more effectively.
Sun Life Active Fixed Income Solutions for consideration:
Our three key active fixed income solutions offer access to seasoned sub-advisors with deep domestic and global fixed income experience providing access to hard-to-reach fixed income assets including private credit, bank loans, high-yield bonds, and narrowly syndicated credit.
Sun Life Core Advantage Credit Private Pool Ticker: SLCA |
Sun Life MFS Global Core Plus Bond Fund Ticker: SLGC |
Sun Life Crescent Specialty Credit Private Pool Ticker: SLSC |
Sub-advised by: SLC Management |
Sub-advised by: MFS Investment Management |
Sub-advised by: Crescent Capital Group |
Category: Canadian Fixed Income |
Category: Global Core Plus Fixed Income |
Category: High Yield Fixed Income |
Management fees: Series A: 0.93% Series F & ETF Series: 0.43% |
Management fees: Series A: 0.93% Series F & ETF Series: 0.43% |
Management fees: Series A: 1.20% Series F & ETF Series: 0.70% |