Due to the current Canada Post labour dispute, please expect delays in mail delivery. Service to Sun Life Global Investments’ advisors and Clients remains our top priority.

Our Client Services team might experience longer than usual wait times.

Personal rate of return for Sun Life GIFs

Personal rate of return

Know how your contract’s investments are performing.

Do you know if you’re on track to meet your financial goals? One thing you can do to monitor your goals is check your rate of return.

Rate of return

You’ll hear the term “rate of return (RoR)” used often. It means the gains or losses of an investment over a specific period.

Rate of Return Reporting

Your personal rate of return

There are different ways to calculate a rate of return: we use the “money-weighted” rate of return method. It gives you a personal view of how your contract and funds performed. Important: any withdrawals or deposits into your contract can affect your personal rate of return. Timing can also be a factor.

The example below shows what your personal rate of return may look like on your statement. You’ll see both the total rate of return for your contract and for each individual fund. Reviewing your rate of return can help you monitor your progress towards your financial goals.

For your contract

Period YTD 6 months 1 year 3 year 5 year 10 year Since inception
Return 12.11% 4.95% 12.11% - - - 7.83%

For each fund you are invested in

Fund name
(fund code)
YTD 6 months 1 year 3 year 5 year 10 year Since inception
Sun Life Granite Growth
Back end load (SI235)
9.00% 4.49% 9.00% - - - 7.14%
Sun MFS International Growth
Back end load (SI247)
21.99% 6.29% 21.99% - - - 9.85%

Let’s look at an example

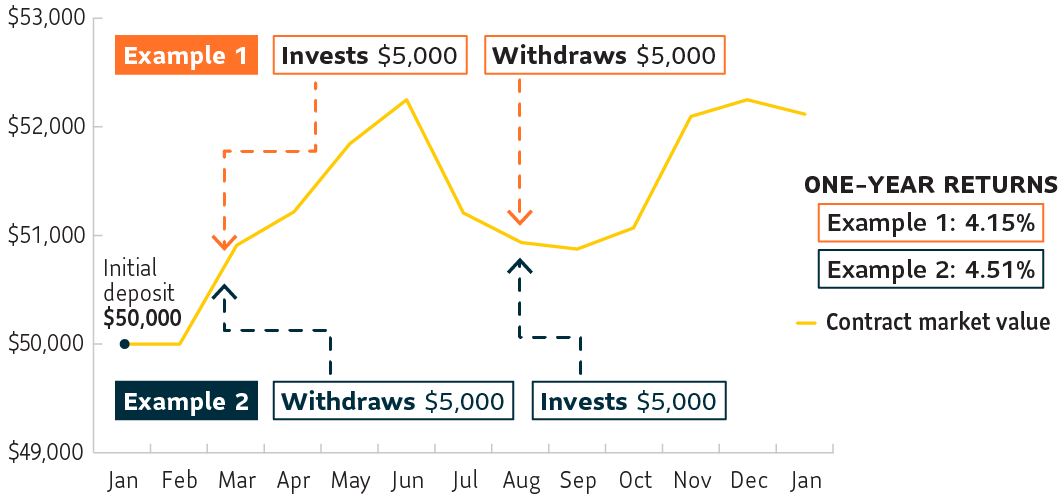
The following example shows how withdrawals, deposits and timing can affect your rate of return. The idea is to deposit extra money when you have it or withdraw money when you need it. You’re not trying to time the markets. To keep this simple, let’s look at the performance of a contract invested in just one fund.

The Y axis (verticle line) shows dollar values of $49,000, $50,000, $51,000, $52,000, and $53,000; the X axis (horizontal line) shows a full year of months beginning with January, plus an additional January at the end. The contract market value starts with an initial depost of $50,000 in January. This amount remains static in Febuary and then steadily increases until June to approximately $52,300. The contract value sharply decreases in June and continues to decrease, but less so, in July, August, and September. After September, the contract value begins to increase again slowly and then sharply increases in late October and November. In December, the contract value continues to increase, but less so. In January of the next year, the contract value begins to decrease. In example 1, the Client adds $5,000 to their contract in March and withdrawals $5,000 in August. The effect to the contract is that the Client receives a 4.15% one year rate of return. In example 2, the Client withdrawals $5,000 in March and invests $5,000 in August. This is the reverse of example 1. The effect to the contract is that the Client receives a 4.51% one year rate of return.

Values and returns shown in the chart are for illustrative purposes only and do not reflect actual returns.

What happened?

The chart shows the money-weighted rate of return of a fund over the course of a year. There are two examples; each uses the same dates and amounts, but reverses the deposit and withdrawal actions.

Example 1

You deposit $50,000 into your contract in January. In March, you deposit another $5,000 while the market is increasing. In August, you withdraw $5,000 while the market is decreasing.

The result: The overall rate of return is 4.15%. This example shows a withdrawal when the market was down.

Example 2

In January, you deposit $50,000 into your contract. You use the same dates and amounts, but you reverse the actions. In March, you withdraw $5,000. In August, you deposit $5,000.

The result: Even though you moved the same amount of money in and out of the contract, your return is 4.51%. By withdrawing money as the market increases in March and re-investing August, you benefit from the market increase that began in October.

Questions?

To learn more about your rate of return, talk to your financial advisor.