Why does income diversification matter?
Many investors want to grow their capital and achieve steady streams of income. There’s a solution.

The income challenge
Investors face a lot of pressure right now. With today’s volatility, inflation and interest rate concerns, it’s not easy for them to balance risk and reward. This has prompted many income-seeking investors to take on more risk to achieve higher income in both bond and equity markets. Today’s income challenge is complex for both advisors and investors, with many factors to consider:
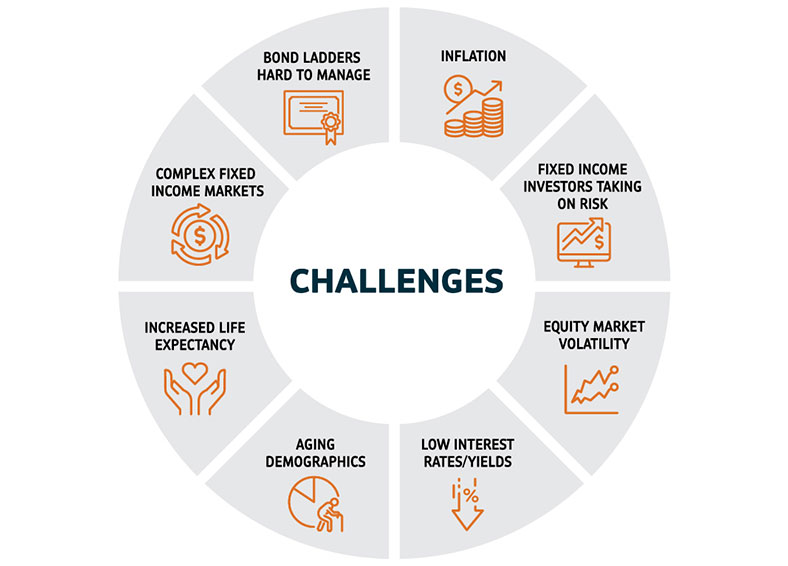
Assessing all the risks and opportunities takes time and one can quickly become overwhelmed. Historically, income seekers may have been able to invest in bonds to secure enough yield to fulfill their annual income needs; but that’s unlikely to be true today.
Fixed income alone may not be enough in retirement
Today’s muted yields and fixed income returns are unlikely to support the longevity needs of many income-seeking investors, who are now living longer lives.
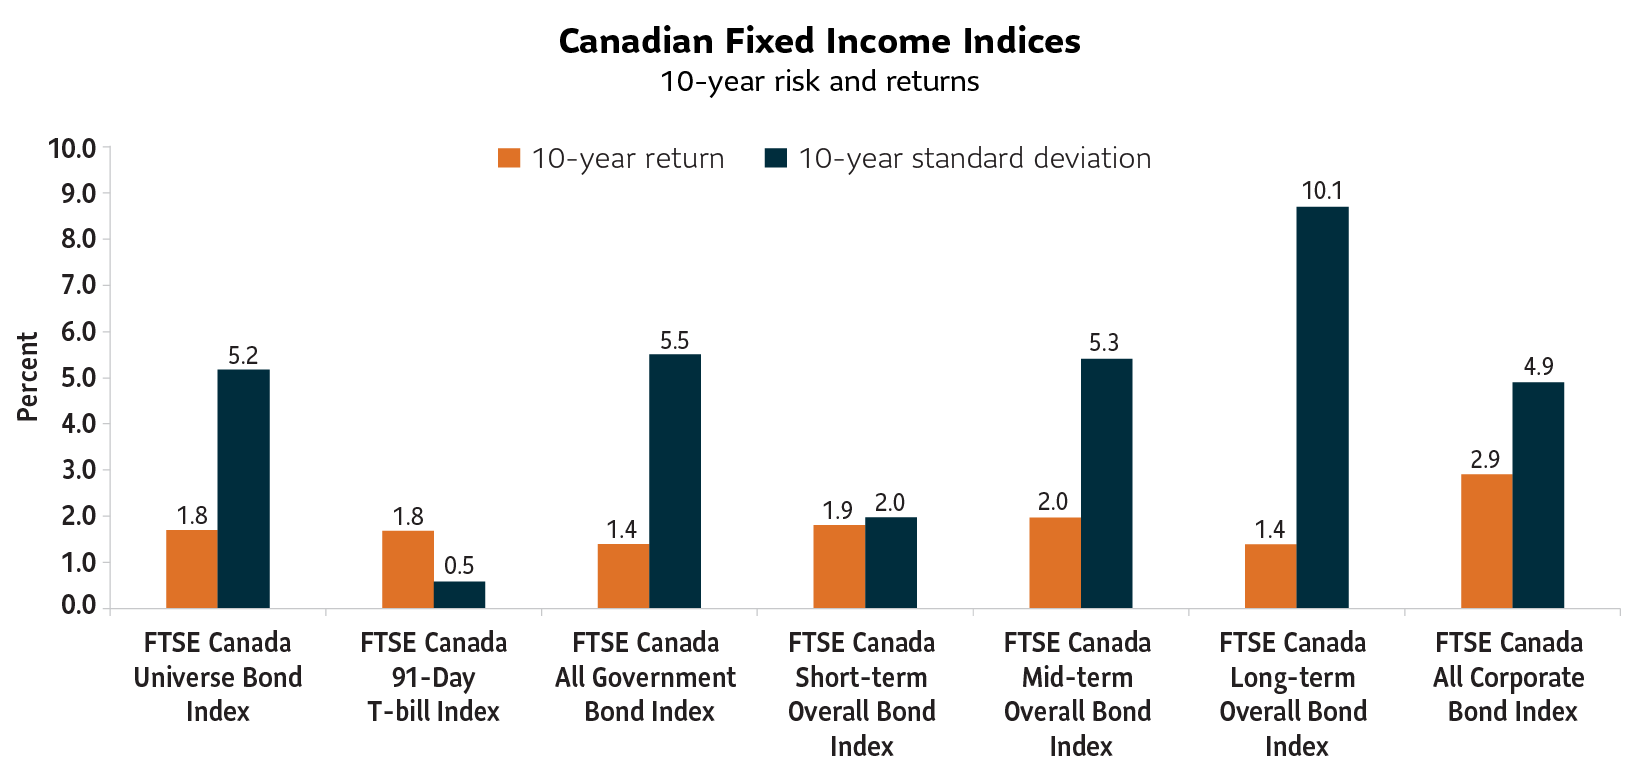
Source: Morningstar Direct. All data as of May 31, 2025. You cannot invest directly in an index.
As you can see, the chart above illustrates the returns and risk of various Canadian fixed income asset classes over the last ten years. For example, the FTSE Canada Universe Bond Index – the over-arching benchmark for Canadian bonds – only returned 1.8% over the decade (before inflation).
If we look past the chart, in addition to muted returns, investors have also taken on duration risk. Currently, the FTSE Canada Universe Bond Index has a duration of 7.11 years and an average yield of 3.48% (Source: Morningstar Direct as of May 31, 2025).
With the index’s duration relatively high and risk rising, an active management approach with more differentiated fixed income asset classes may be required.
In response, many Canadians have looked outside our borders for more yield, returns or lower correlation from their bonds. This may be good from a diversification standpoint, but it leaves many investors trying to determine the best place to invest.
Duration:
Duration measures a bond’s price sensitivity to interest rate changes. In general, the higher the duration, the more a bond’s price will drop as interest rates rise.
Equities alone may be too volatile
If history teaches anything, investors tend to take on too much equity risk at the wrong time.
Looking at the U.S. S&P 500 Index as a proxy for equities, volatility has increased substantially from 2024. In the first five months of 2025, we have endured more negative days with losses greater than 1% and 2% compared to all of 2024.
| 2024 | 2025 (YTD) | ||||
|---|---|---|---|---|---|
| No. of days index lost more than 1% | No. of days index lost more than 2% | No. of days index lost more than 1% | No. of days index lost more than 2% | ||
| S&P 500 TR Index | 19 days | 4 days | 20 days | 6 days | |
Source: Morningstar Direct. Data as of May 31, 2025. All data shown is in U.S. dollars. You cannot invest directly in an index.
In retirement, investors need to find ways to benefit from the longevity advantages of equities while also minimizing annual volatility (which can have a detrimental impact on retirement assets).
If fixed income can’t fund most of an investor’s retirement, and if equities alone might be too volatile, what should they do?
Combine asset classes
One strategy investors can consider is to optimize their exposure to income-generating asset classes.
For example, these income-generating asset classes show low correlation between them, demonstrating a clear opportunity to blend them together in a diversified portfolio.
| Correlations | 1 | 2 | 3 | 4 | 5 | 6 |
|---|---|---|---|---|---|---|
| 1 Global dividend-paying equities | 1.00 | |||||
| 2 Canadian dividend-paying equities | 0.66 | 1.00 | ||||
| 3 Global real estate investment trusts (REITs) | 0.80 | 0.60 | 1.00 | |||
| 4 Canadian corporate bonds | 0.40 | 0.43 | 0.54 | 1.00 | ||
| 5 U.S. high yield bonds | 0.44 | 0.24 | 0.51 | 0.48 | 1.00 | |
| 6 Emerging markets debt | 0.35 | 0.11 | 0.44 | 0.59 | 0.73 | 1.00 |
Source: Morningstar Direct. Data as of May 31, 2025. All returns are in Canadian dollars. Asset classes are represented by the following indexes: Global dividend paying equities – MSCI ACWI High Dividend Yield Index; Canadian dividend paying equities – S&P/TSX Capped Composite Index; Global REITs – FTSE/EPRA Nareit Developed Index; Canadian corporate bonds – FTSE Canada All Corporate Bond Index; U.S. High Yield bonds – Bloomberg U.S. High Yield 2% Issuer Capped Index, Emerging markets debt – JPMorgan EMBI Global Diversified Index.
Correlation:
A statistic that measures the degree to which two securities move in relation to each other. Correlation is measured on a scale of -1 (perfect negative) to +1 (perfect positive). Choosing assets with low correlation with each other can help to reduce portfolio risk.
Looking at returns and volatility, we also see a potential benefit from blending and optimizing the allocations in these asset classes. For investors seeking income it could be winning combination that balances growth to keep up with inflation, and the need for longevity of returns.
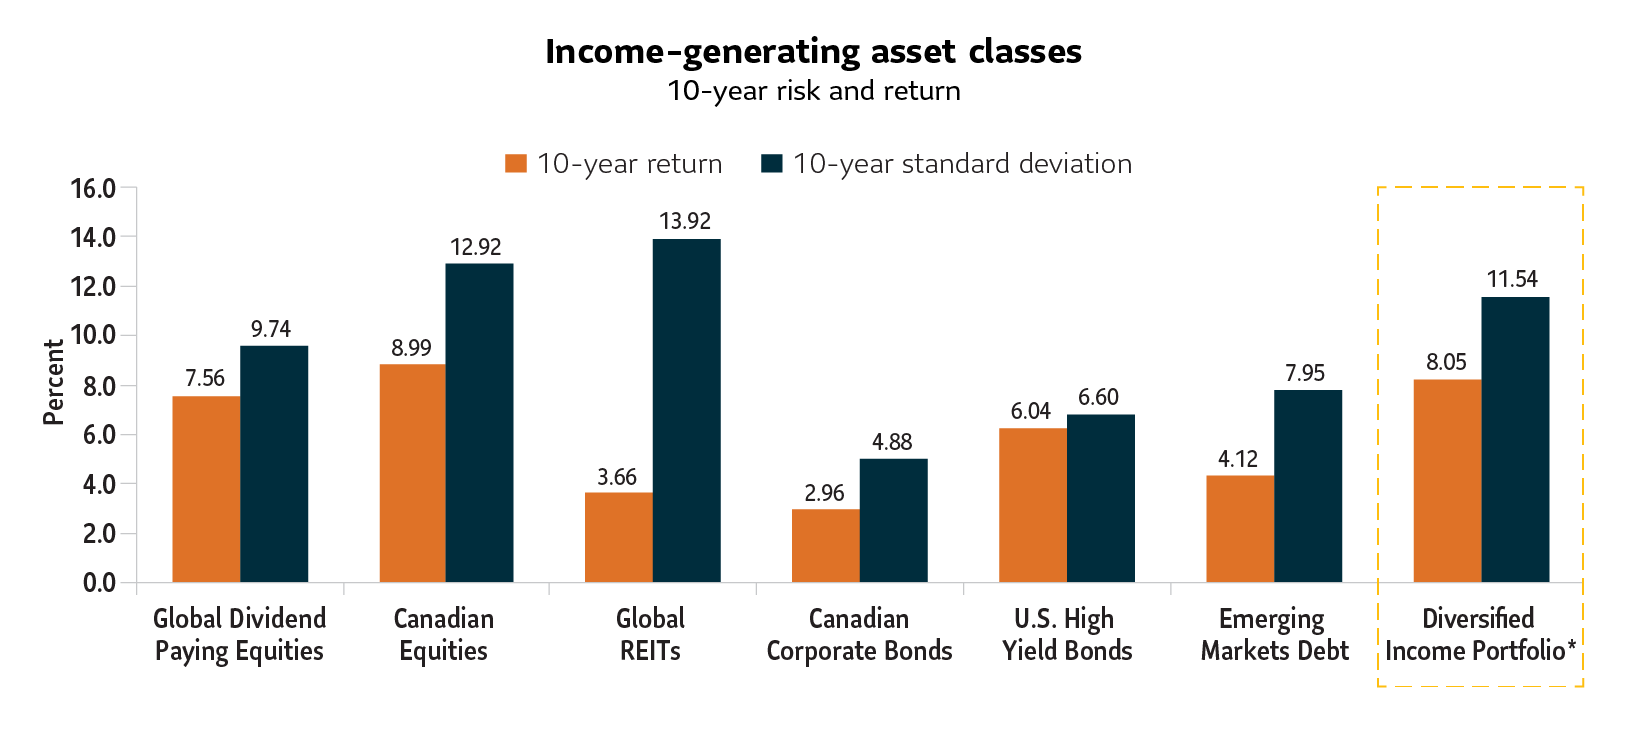
Source: Morningstar Direct. Data as of May 31, 2025. All returns are in Canadian dollars. Asset classes are represented by the following indexes: Global dividend paying equities – MSCI ACWI High Dividend Yield Index; Canadian dividend paying equities – S&P/TSX Capped Composite Index; Global REITs – FTSE/EPRA Nareit Developed Index; Canadian bonds – FTSE Canada All Corporate Bond Index; U.S. High Yield bonds – Bloomberg U.S. High Yield 2% Issuer Capped Index, Emerging Markets Debt – JPMorgan EMBI Global Diversified Index.
*Diversified Income Portfolio is represented by: 30% MSCI ACWI High Dividend Yield Index, 10% S&P/TSX Capped Composite Index, 15% FTSE EPRA Nareit Developed Index, 17.5% FTSE Canada All Corporate Bond Index, 17.5% Bloomberg U.S. High Yield 2% Issuer Capped Index, 10% JPMorgan EMBI Global Diversified Index. You cannot invest directly in an index.
Optimize asset classes for enhanced yield potential
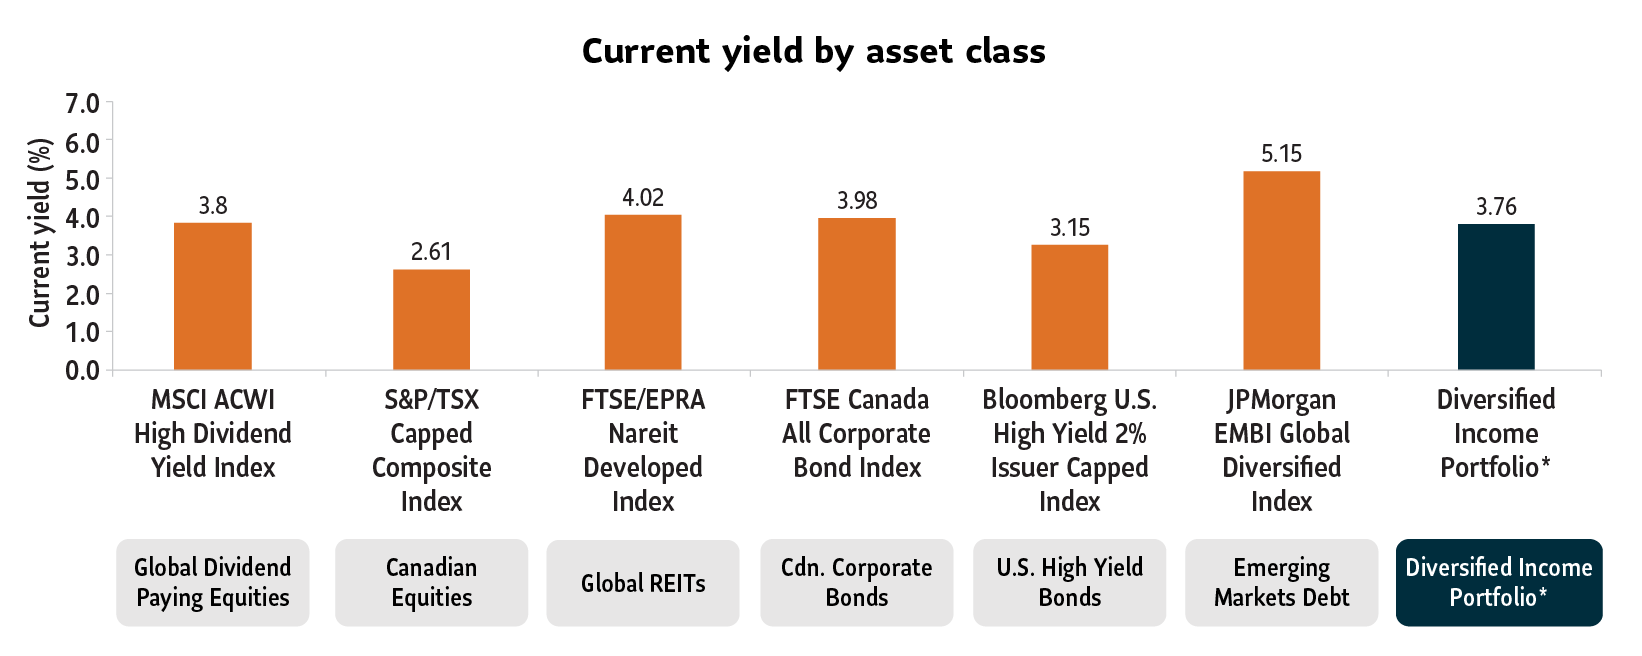
Source: Morningstar Direct. Data as of May 31, 2025. All returns are in Canadian dollars. *Diversified Income Portfolio is represented by: 30% MSCI ACWI High Dividend Yield Index, 10% S&P/ TSX Capped Composite Index, 15% FTSE EPRA Nareit Developed Index, 17.5% FTSE Canada All Corporate Bond Index, 17.5% Bloomberg U.S. High Yield 2% Issuer Capped Index, 10% JPMorgan EMBI Global Diversified Index. You cannot invest directly in an index.
Here you can see the current yield on income-generating equity and bond assets. The chart shows that by mixing and optimizing these asset classes, you can generate an attractive level of potential yield.
This can be especially attractive for retirees who need a steady income, coupled with a balanced degree of equity exposure to help fight inflation and longevity risk.
Help smooth annual returns over time
Asset class performance changes every year, so trying to time the market by concentrating on a certain asset class can be a losing proposition.
In this graphic, you can see returns were steadier by optimizing allocations in the Blended (balanced) portfolio. The Blended portfolio benefits from the asset classes that are doing the best, while not being over-allocated to the asset classes that are doing the worst. The result is a more balanced, smoother return pattern over time.
Calendar year asset class returns
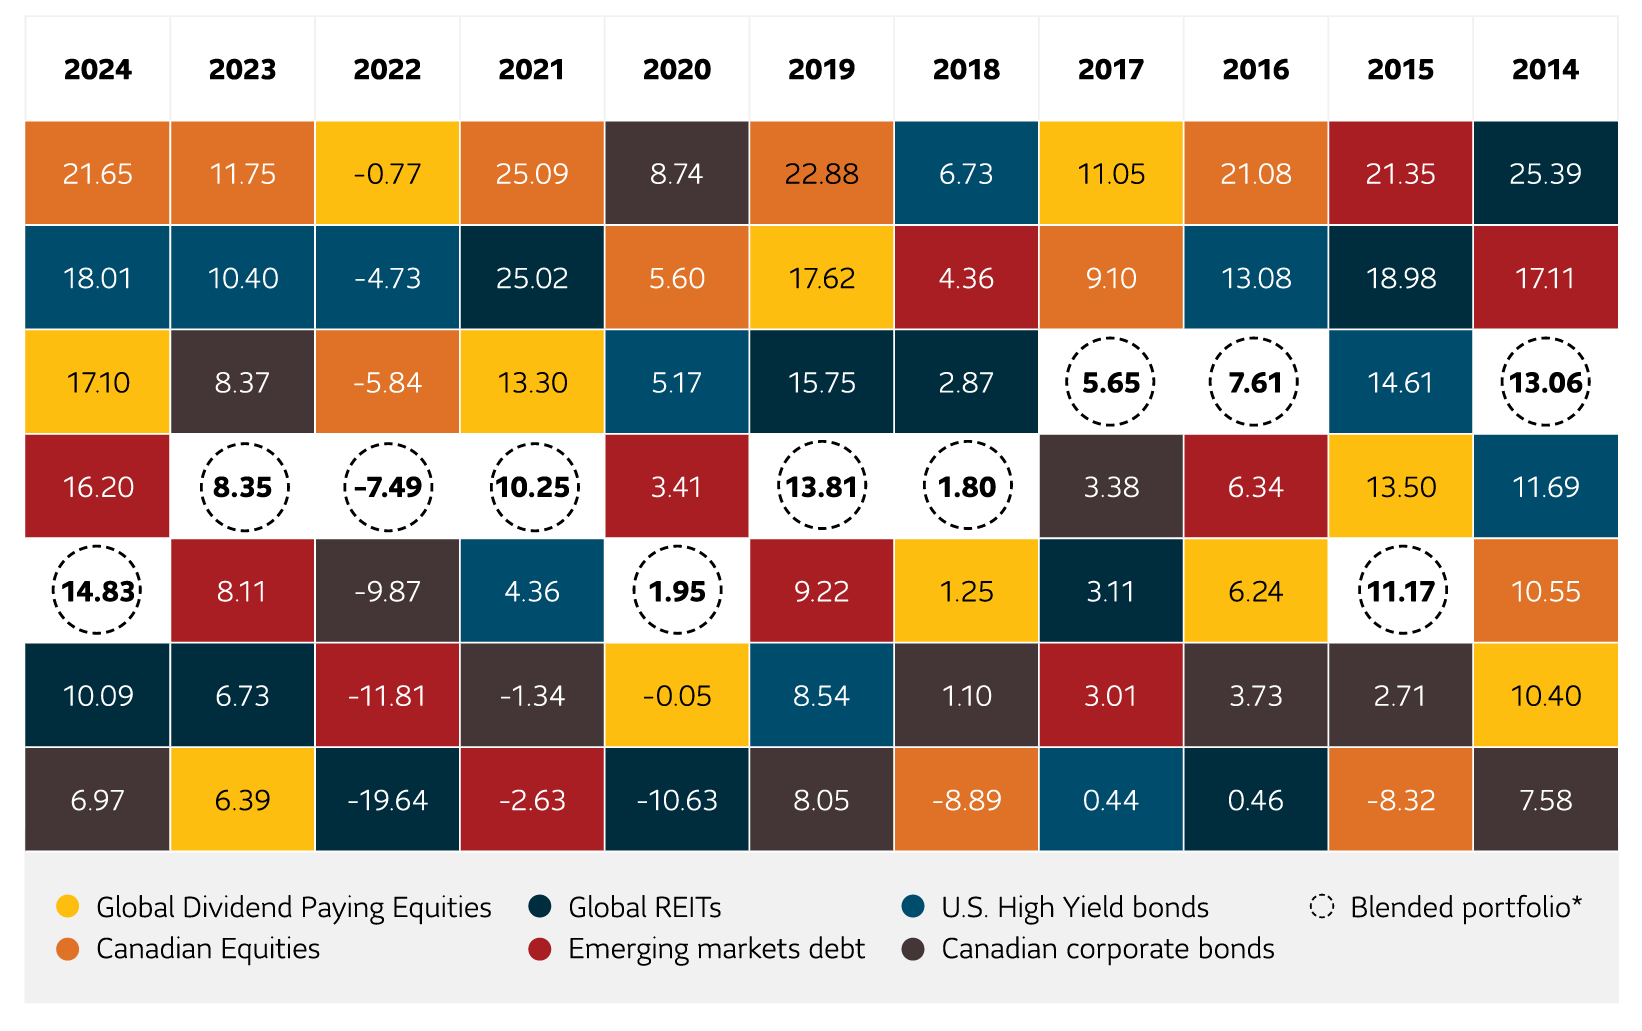
Source: Morningstar Direct. Data as of December 31, 2024. Calendar year returns in Canadian dollars.
Asset classes are represented by the following indexes: Global dividend paying equities – MSCI ACWI High Dividend Yield Index; Canadian equities – S&P/TSX Capped Composite Index; Global REITs – FTSE/EPRA Nareit Developed Index; Canadian corporate bonds – FTSE Canada All Corporate Bond Index; U.S. High Yield bonds – Bloomberg U.S. High Yield 2% Issuer Capped Index; Emerging markets debt – JPMorgan EMBI Global Diversified Index.* Blended portfolio is represented by: 30% MSCI ACWI High Dividend Yield Index, 10% S&P/TSX Capped Composite Index, 15% FTSE/EPRA Nareit Developed Index, 17.5% FTSE Canada All Corporate Bond Index, 17.5% Bloomberg U.S. High Yield 2% Issuer Capped Index, 10% JPMorgan EMBI Global Diversified Index. You cannot invest directly in an index.
To achieve their objectives, retirement-focused funds should offer a mix of broad asset classes, capital appreciation, income and volatility mitigation.
Canadian investors can now benefit from a solution that optimizes these income asset classes while also adding a disciplined, incremental approach to tactical asset allocation (which can also help add additional growth potential) – Sun Life MFS Diversified Income Fund, sub-advised by MFS Investment Management (MFS).
Who is behind this asset mix?
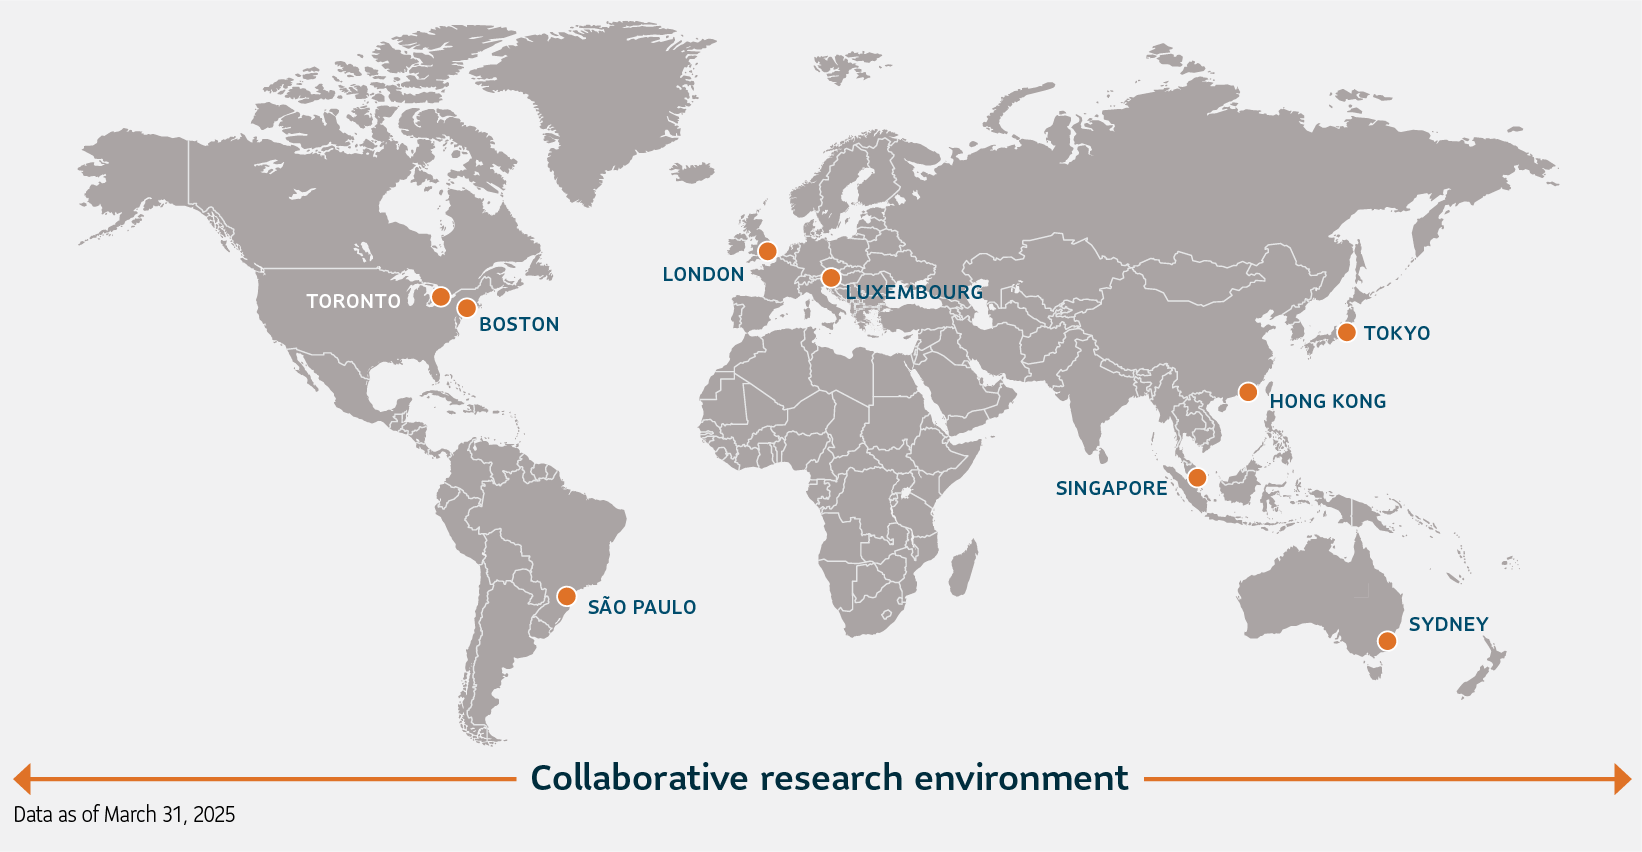
Since 1924, MFS has created long-term value for investors by allocating capital responsibly. Through all these years, they have leveraged what they consider their greatest strengths and the most important contributors to long-term returns: security selection, in-depth research and global collaboration.
MFS Investment Management: Global Research
107Fundamental research analysts 26 U.S. Equity Analysts38 Non-U.S. Equity Analysts 53 Credit Analysts 5 Dedicated ESG Research Analysts; backed by 37 Research/ Investment Associates |
8Global sector teams Organized by region and sectors |
12Analyst managed strategies Global, regional and country- specific strategies with security selection driven by dedicated sector teams on the ground, globally |
101Portfolio managers with significant industry experience in value, core, growth, quantitative and fixed income investing |
12Quantitative research analysts16 Quantitative analysts; backed by 14 Quantitative research associates |
Through their powerful global investment research platform, MFS uncovers what they believe are the best investment opportunities in both fixed income and equity markets using a time-tested three pillar process:
Collective expertise
- Integrated research
- Diversity & collaboration
- Engagement
Long-term discipline
- Conviction & longer time horizons
- Alignment of incentives
- Continuity & succession planning
Active risk management
- Risk-aware culture
- Understand material risks
- Capacity management
By fully leveraging their world-wide research capabilities to source ideas and trusting the collective expertise of their investment professionals, MFS has carefully selected six distinct income-generating asset classes, fully optimizing them to maximize return potential while minimizing volatility. They have combined them into a single mandate – Sun Life MFS Diversified Income Fund.
Sun Life MFS Diversified Income Fund
A multi-asset, income-oriented global balanced portfolio.
Multi-asset
Multi-asset, core global balanced portfolio.
Income-oriented
Six distinct asset classes to generate income and capital appreciation.
Disciplined. Yet flexible.
Neutral mix of 55% equities/45% fixed income. Disciplined tactical shifts: +/- 5% to underlying strategies.
Fund highlights
- REITs, investment grade debt, high yield corporate debt and emerging markets debt.
- Each asset class has a highly experienced management team from MFS who directly controls the security selection for their respective asset class.
- The allocations to each asset class are then fully optimized by MFS’ global investment strategist to maximize return potential, while minimizing volatility.
- The target or neutral allocation is 55% income-oriented equities and 45% fixed income.
- MFS also has the flexibility to make tactical adjustments to the allocations to capitalize on market dislocations.
- The tactical approach is disciplined with a +/-5% over-/underweight to the underlying asset classes.
This disciplined approach allows investors to potentially benefit from market dislocations without taking on the elevated risk associated with significant changes in their core asset allocation. The Fund could be a great fit for retired investors who want a predictable source of income, balanced with capital appreciation potential.
For more information, speak to your advisor or:
Learn more about the Sun Life MFS Diversified Income Fund
Information contained in this document is provided for information purposes only and is not intended to provide specific financial, tax, insurance, investment, legal or accounting advice and should not be relied upon in that regard and does not constitute a specific offer to buy and/or sell securities. Views expressed regarding a particular company, security, industry, or market sector should not be considered an indication of trading intent of any mutual funds managed by SLGI Asset Management Inc. These views are subject to change and are not to be considered as investment advice nor should they be considered a recommendation to buy or sell. Please note, any future or forward-looking statements contained in this document are speculative in nature and cannot be relied upon. There is no guarantee that these events will occur or in the manner speculated. Please speak with your professional advisors before acting on any information contained in this article.