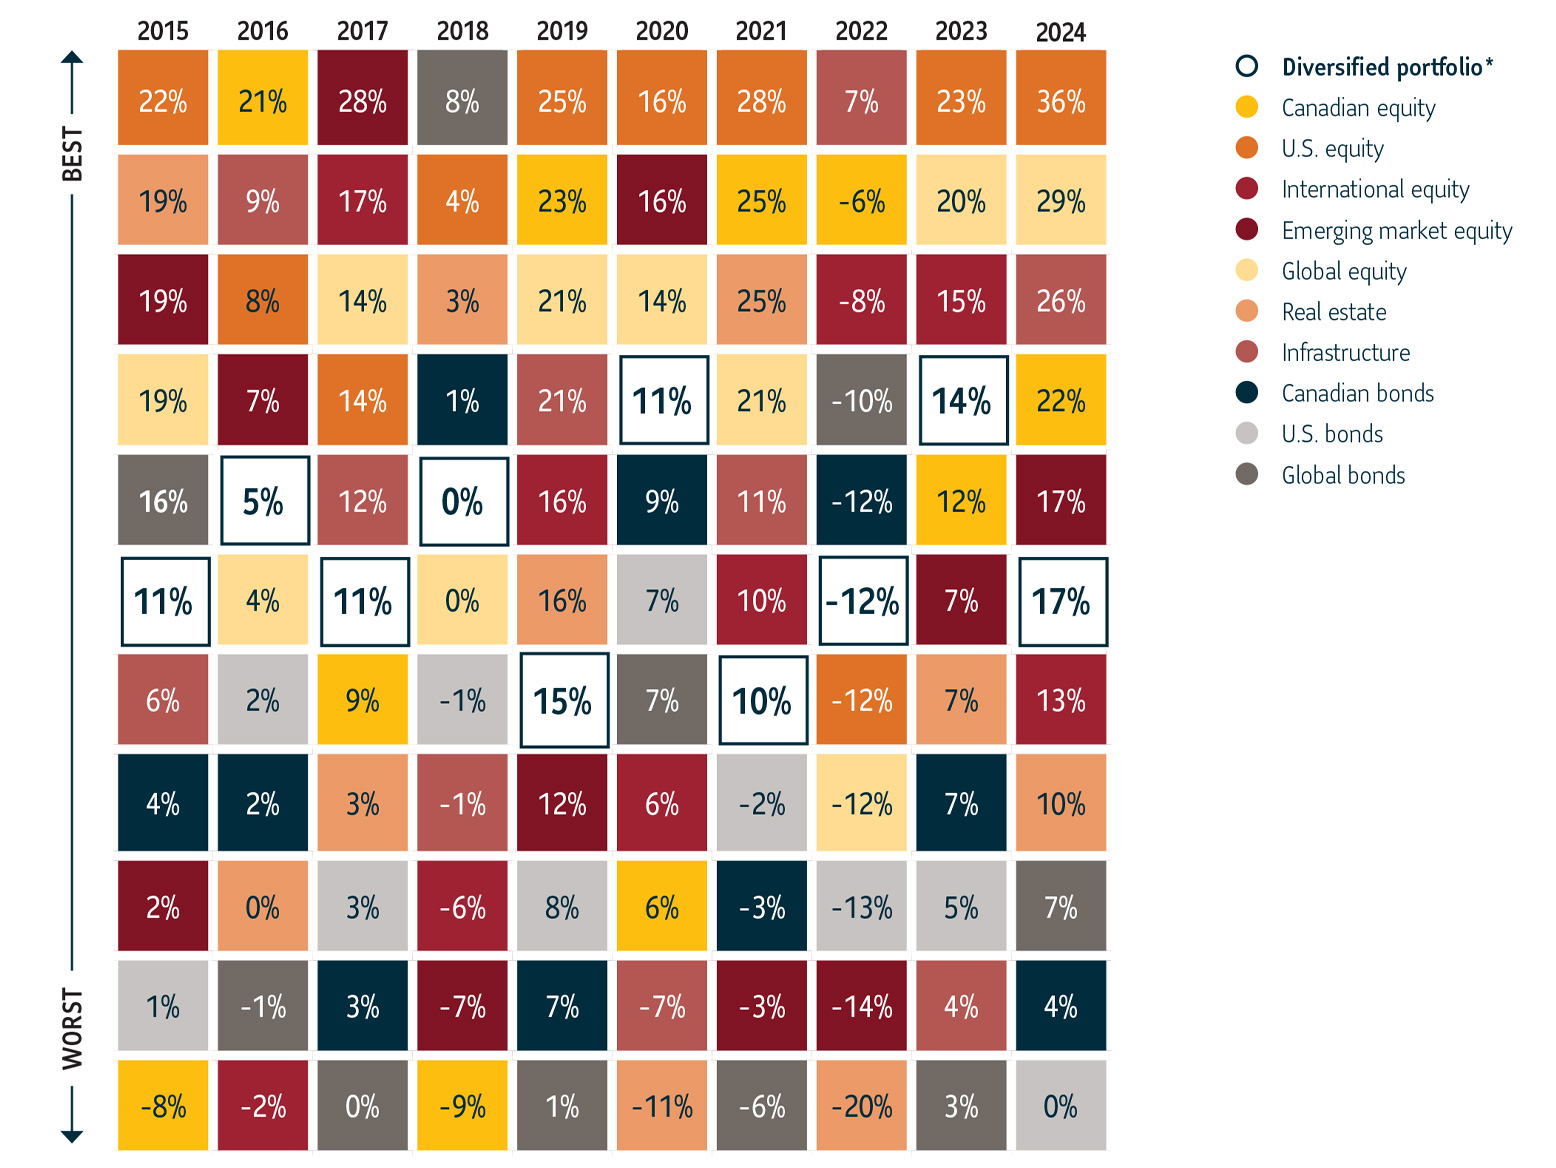
Diversifying to reduce risk is a key investment strategy. The reason: not all investments will perform in the same way at the same time. By holding a mix of bonds and equities across different markets and countries, some may be increasing in value while others are falling. This can help reduce the risk that comes from being overly concentrated in just a few investments. And over time, it tends to reduce volatility and smooth out returns.
Use the chart below to see how being diversified can help reduce risk
Pick an asset class from the boxes below and follow it across. As it reacts to market and economic conditions, the asset class may be a top performer one year and the worst the next. Now compare it to a hypothetical diversified portfolio*, which invests in a number of asset classes, and you will see the returns are less volatile and more consistent over time.

For illustrative purposes only. Returns have been rounded to the nearest whole number for simplicity. *The Diversified portfolio is a hypothetical portfolio that is invested as a 60/40 mix of MSCI ACWI All Cap GR USD (60%) and BBgBarc Global Aggregate TR Hdg CAD (40%). The Diversified Portfolio is not intended to represent any investment managed by Sun Life Global Investments. It is not possible to invest in an index. For more information on the indices used to represent each asset class, please see reverse.
At Sun Life Global Investments, we believe long-term investment success requires effective risk management, and diversification plays a powerful role in that strategy.
For more information, speak to your advisor.
ABOUT THE CHART
Equity returns are represented by the following indices in C$ terms and include reinvestment of dividends: U.S. stocks: S&P 500 Total Return Index; Canadian stocks: S&P/TSX Capped Composite Total Return Index; International stocks: MSCI EAFE NR Index; Emerging market stocks: MSCI EM Net Return Index; Global stocks: MSCI World Net Return Index; Real estate: FTSE EPRA/NAREIT Developed Total Return Index; Infrastructure: S&P Global Infrastructure Total Return Index; Canadian bonds: FTSE Canada Universe Total Return Index; U.S. bonds: Bloomberg U.S. Aggregate Total Return Hedged Index; Global bonds: Bloomberg Global Aggregate Total Return Index. The performance of each index including the diversified portfolio is provided to illustrate historical market trends; it does not represent the performance of a particular Sun Life Global Investments product. Source: Morningstar. Data as of December 31, 2024.
The information provided is not intended to be investment advice. Investors should consult their own professional advisor for specific investment and/or tax advice tailored to their needs when planning to implement an investment strategy to ensure that individual circumstances are considered properly, and action is taken based on the latest available information. Views expressed regarding a particular company, security, industry or market sector are the views of the writer and should not be considered an indication of trading intent of any investment funds managed by SLGI Asset Management Inc. These views are subject to change at any time and are not to be considered as investment advice nor should they be considered a recommendation to buy or sell.


