
Understanding market cap:
If you’re investing to pursue long-term financial goals, understanding the relationship between company size, return potential, and risk is critical. Market capitalization—or market cap—refers to the total value of all a company’s shares of stock. It’s calculated by multiplying the price of a stock by its total number of outstanding shares.
Market cap allows you to understand the relative size of one company versus another. There are certain traits that are generally associated with small, mid, and large-cap companies.
Small-caps |
Mid-caps |
Large-caps |
|---|---|---|
| Development stage | High growth stage | Maturity/declining growth stage |
General business characteristics:
|
General business characteristics:
|
General business characteristics:
|
| Higher business risk | Medium business risk | Lower business risk |
For illustrative purposes only.
Defining U.S. mid-caps:
The Russell Midcap Index is a commonly used index for measuring U.S. mid-cap performance. The Index consists of over 800 companies and represents about 31% of the total U.S. equity market*.
| Company size | Small | Mid | Large |
|---|---|---|---|
| Benchmark |
Russell 2000 Index | Russell Midcap Index | Russell 1000 Index |
| Average market cap | $US 3.4 B | $US 25.5 B | $US 201.9 B |
| Approx. % of U.S. Equities | 10% | 31% | 59% |
| Number Of Companies | 1,971 | 825 | 1,021 |
Source: Morningstar Direct, Russell Indices; data as of August 31, 2021.
* As defined by the Russell 1000 Index, which measures the performance of the large-cap segment of the U.S. equity universe.
U.S. mid-cap company characteristics
U.S. mid-caps are typically in the high growth stage of their maturity. They combine two positive elements in their business development cycle: accelerated investment growth and tapered business risk. Together, these create an investment “sweet spot.” In addition, they have several attractive business attributes, including:
- Established products and market strategies
- Strong historical profitability
- Well established management teams
- Long-term growth potential
U.S. mid-caps are often in the process of increasing market share and improving their overall competitiveness. They have generally evolved in their cost efficiencies, product strategies, and key competitive advantages. U.S. mid-caps are established businesses and often fall within industries that are experiencing, or are expected to experience, rapid growth. This stage of growth is likely to determine whether they live up to their full future potential.
Why U.S. mid-caps?
Long-term outperformance
These above characteristics have led to 40+ years of consistent outperformance relative to small and large-cap companies. Data for the small, mid, and large cap companies goes all the way back to 1979 and is shown in the chart below, as illustrated.
Growth of $100,000: Jan. 1979 to Aug. 31, 2021
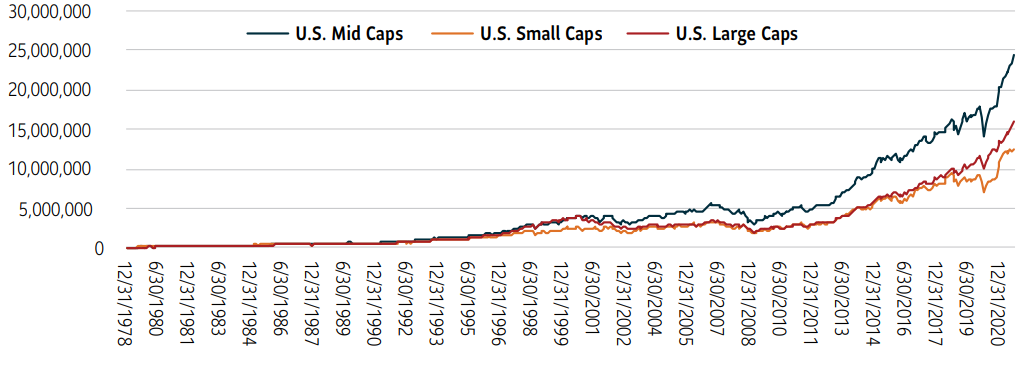
For illustrative purposes only: Source Morningstar Direct. Period ended August 31, 2021. U.S. mid-caps are represented by the Russell Midcap Index; large caps by the Russell 1000 Index; and small caps by the Russell 2000 Index. You cannot invest directly in an index. Mutual funds are subject to fees and expenses that are not applicable to an index, and which reduce returns.
Strong risk adjusted returns
Mid-caps can bring together some of the best traits of large and small companies: they generally grow faster than large businesses, often with less volatility than small companies. That means they bring the potential for strong capital growth, as well as size diversification. Over the past 20 years, mid-caps have had better risk adjusted returns as shown below:

For illustrative purposes only: Source Morningstar Direct. Data shows annualized total returns, standard deviation, and Sharpe ratios for the 20-year period ended August 31, 2021. U.S. mid-caps are represented by the Russell Midcap Index, large-caps by the Russell 1000 Index, and small caps by the Russell 2000 Index. You cannot invest directly in an index. Mutual funds are subject to fees and expenses that are not applicable to an index, and which reduce returns. Sharpe ratio is a risk-adjusted measure that measures reward per unit of risk taken. The higher the ratio, the better. The numerator is the difference between an annualized return and a risk-free asset. The denominator is measured by annualized standard deviation. Standard deviation measures the degree to which the performance of an asset varies from its average performance during a specific time period. The higher the standard deviation, the greater the volatility (or risk) of performance vs. its average return.
Mid-caps often perform well after market recovery
If you delve even deeper into U.S. mid-cap investment returns, they can be an excellent asset class coming out of financial recessions. Often, mid-cap companies have tended to outperform large companies in the early stages of an economic recovery, as investors begin to take on more risk. For example, after the U.S. recession in the early 2000s, mid-caps outperformed large-caps for three years in a row – from 2003 to 2005. As well, mid-caps did very well after the global financial crisis that occurred from December 2007 to June 20091 . As you can see from the chart below, from 2009 to 2013, mid-cap stocks outperformed their larger-cap counterparts in four out of the five years coming out of that recession.
Calendar year returns (2000-2020)
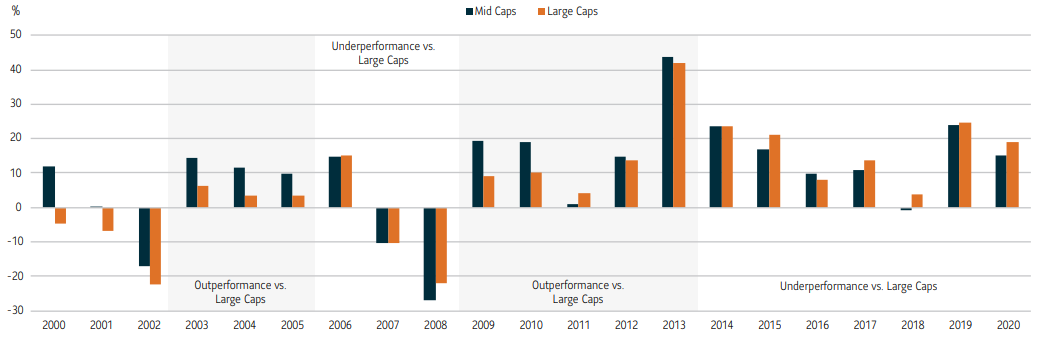
Source Morningstar Direct. Data as at August 31, 2021. U.S. mid-caps are represented by the Russell Midcap Index and large-caps by the Russell 1000 Index. You cannot invest directly in an index. Mutual funds are subject to fees and expenses that are not applicable to an index, and which reduce returns.
More recently, from 2014 to 2020, mid-cap stocks have lagged large caps. This longer cycle of underperformance suggests that mid-caps could be a neglected part of the market today. Additionally, although past performance is not a guarantee of the future, as economies continue to recover from the COVID-19 induced recession in 2020, U.S. mid-caps may prove to be an attractive opportunity in the coming years.
Attractive acquisition targets
Looking beyond returns, mid-caps can also become attractive targets for purchase by large companies. It is often easier for a larger company to buy a particular innovation or product line than it is to build it internally. While the COVID-19 pandemic is not over, the global economy is showing signs of recovery. Recently, in the first two quarters of 2021, 233 merger deals have been announced in the U.S. – which is approximately 96% of the total for all of 2018. Even if merger and acquisition (M&A) activity stays flat later this year, this would be nearly 100% higher than the pandemic disrupted totals in 2020. Deal activity is expected to remain strong heading into 2022.2
Mid-market M&A transactions Q2 2020 - Q2 2021
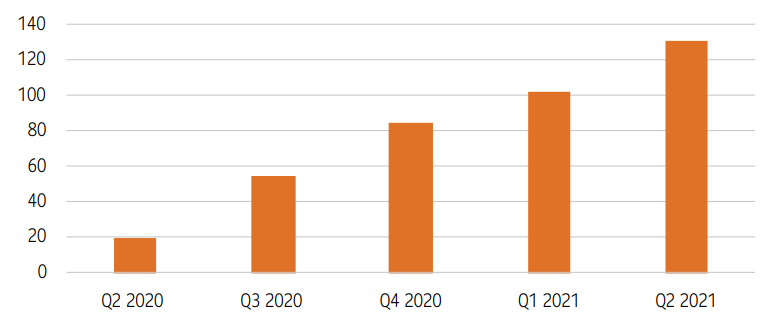
Source: Bryan Cave Leighton Paisner (BCLP); “Mid-Market M&A Barometer, Issue 2: August 2021.”
This may bode well for the subsequent performance of mid-cap stocks, as their stock prices tend to run higher on anticipation of merger rumours.
Academic and analyst coverage
Lastly, academics and fundamental analysts are engaged in researching and measuring the value of securities. Despite the balance of risk and return that mid-caps offer, these academics and analysts may not always pay them the attention that they deserve. Instead, they often favour covering large cap firms or small cap firms (to a lesser degree)3. There are reasons for this, namely that, often, large caps are high profile businesses that frequently receive strong media coverage. Although small cap firms may receive less analyst coverage, they do have a history of academic attention relating to assembling portfolios that is easily built upon. Some investors may assume that they have covered all asset classes by only allocating to small and large-cap stocks, perhaps neglecting mid-caps altogether. The result is that you could be missing out on an important asset class in your investment portfolio.
Grasp the mid-cap opportunity
Sun Life MFS U.S. Mid Cap Growth Fund
Sub-advised by a highly experienced investment team from MFS Investment Management, Sun Life MFS U.S. Mid Cap Growth Fund takes the approach that strong risk adjusted returns in the mid-cap space come from investing in high quality, high growth companies over the long-term.
The Fund leverages the same team that manages Sun Life MFS U.S. Growth Fund, one of Sun Life Global Investments’ longest-standing funds.
Sun Life MFS U.S. Mid Cap Growth Fund offers investors:
- Access to medium sized, innovative U.S. companies
- Exposure to high quality companies with the potential for above average, sustainable earnings growth
- A long-term research driven approach, focused on picking stocks across full market cycles
- An opportunity to leverage MFS’ global research platform – to unearth those hidden mid-cap gems.
For more information, contact your advisor or visit sunlifeglobalinvestments.com/choosemfs
1 Recessionary periods as defined by the U.S. Bureau of Economic Research (NBER).
2 Source: Bryan Cave Leighton Paisner (BCLP); “Mid-Market M&A Barometer, Issue2: August 2021.”
3 State Street Global Advisors; “Investing in the Potential Sweet Spot: The Case for Mid Caps” by Matthew J. Bartolini, CFA, Head of SPDR Americas Research; January 28, 2021.
Commissions, trailing commissions, management fees and expenses all may be associated with mutual fund investments. Please read the prospectus before investing. Mutual funds are not guaranteed, their values change frequently, and past performance may not be repeated.
Information contained in this document is provided for information purposes only and is not intended to provide specific financial, tax, insurance, investment, legal or accounting advice and should not be relied upon in that regard and does not constitute a specific offer to buy and/or sell securities. Views expressed regarding a particular company, security, industry, or market sector should not be considered an indication of trading intent of any mutual funds managed by SLGI Asset Management Inc. These views are not to be considered as investment advice nor should they be considered a recommendation to buy or sell. Please note, any future or forward-looking statements contained in this document are speculative in nature and cannot be relied upon. There is no guarantee that these events will occur or in the manner speculated. Please speak with your professional advisors before acting on any information contained in this article.