What is the VIX volatility index & why it matters
The Volatility Index (the VIX) is a widely used indicator that measures the volatility of the S&P 500 Index. It helps measure expectations about how much the S&P 500 index will swing over the next 30 days.

When the VIX spikes, stocks tumble
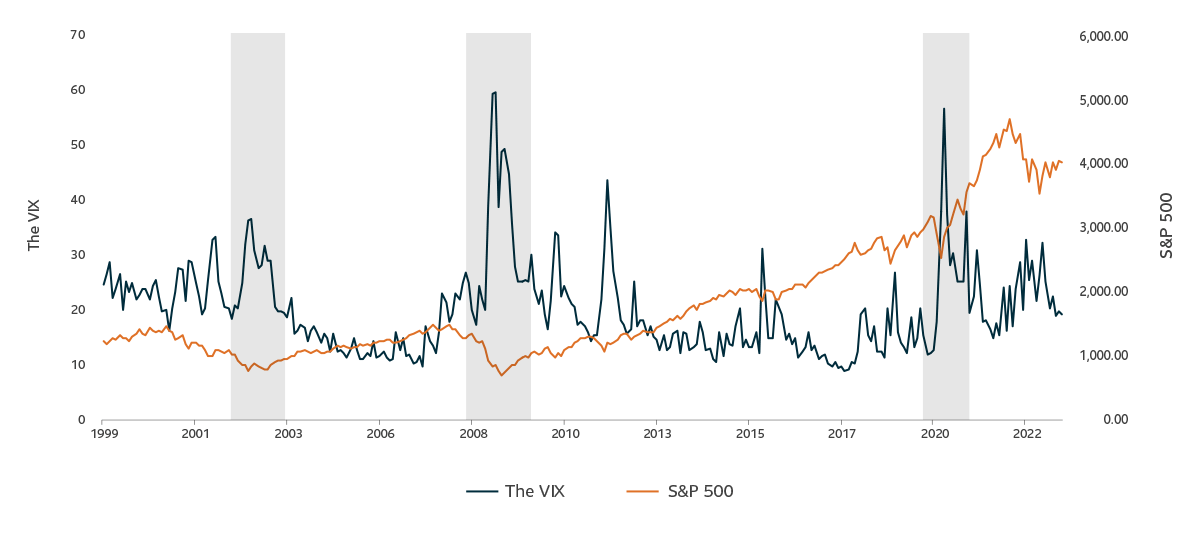
In the world of equities there is only one certainty: fluctuation. Stocks move up and down all the time. On most days, a well-functioning stock market rises or falls only a little. For example, the benchmark Standard and Poor’s 500 Index (S&P 500), which measures the performance of the broad U.S. equity market, often moves up 1% or down 1% most days.
But sometimes the S&P 500 moves a lot more than that. Remember the nightmarish days when COVID-19 shut down the global economy? On March 16, 2020, the S&P 500 fell 12% as fearful investors rushed to sell stocks. And opposite to that, euphoric traders sometimes bid up prices of company shares. On December 26, 2018, the S&P 500 jumped 5%, one of the best days on record for the index. Extreme moves like this add to market volatility.
Measuring volatility is an integral part of market analysis. Volatility not only helps to explain factors that influence markets, it also helps to manage risk. For instance, investors who expect volatility to rise in the future, may reduce their exposure to markets by selling stocks beforehand.
Equity market volatility is measured in a few ways. The Chicago Board Option Exchange’s Volatility Index (the VIX) is a widely used indicator that measures the implied volatility of the S&P 500 Index. In other words, the VIX helps to measure expectations about how much the S&P 500 index will swing over the next 30 days.
When uncertainty and fear dominate equity markets, the VIX rises. But during times of optimism and stability, the VIX tends to be low. Because of how it indicates the stock market’s level of calmness, the VIX is commonly known as the ‘fear index’ or the ‘fear gauge.’ Without getting into the VIX’s math, here is a quick guide as to what various VIX levels indicate.
| The VIX level | What it typically indicates |
|---|---|
| Below 15 | Optimism dominates and markets are rising thanks to low volatility |
| 15 - 25 | Indicates a certain level of market volatility but optimism remains |
| 25 - 30 | Markets experience significant volatility and fear is rising |
| 30 and above | Markets experience turbulence and nervous investors are selling stocks |
Event examples to show how the VIX works
- The great financial crisis – the VIX spiked to around 80 in September 2008 as Lehman Brothers went bankrupt.
- COVID 19 pandemic – the VIX jumped to levels above 85 in early March 2020, up a lot from levels of around 14 in January 2020.
- Silicon Valley Bank (SVB) bank run – in March 2023, the VIX briefly exceeded 30.
While the VIX gauges fear in the market, it can’t predict how long worry or optimism will continue. For example, a rapid spike in the VIX could fade just as fast. That’s why some contrarian investors enter the market when the VIX is elevated. Also, a high level may spark significant buying opportunities as low stock prices may result in bargain stock prices.
All this fits into why the VIX is a vital tool to help investors understand market sentiment. To sum it all up nicely, billionaire investor Warren Buffet once said, ‘Be fearful when everyone is greedy and be greedy when everyone is fearful.’
Want to learn more about market volatility?
Visit our Market volatility – What now? hub to read more insights.
Are you concerned about market volatility and economic instability?
This article addresses 4 questions you should ask your advisor when markets are volatile.
Information contained in this article is provided for information purposes only. It is not intended to provide or be a substitute for professional, financial, tax, insurance, investment, legal or accounting advice and should not be relied upon in that regard. It also does not constitute a specific offer to buy and/or sell securities. You should always consult your financial advisor or tax specialist before undertaking any of the strategies discussed in this article to ensure that all elements and your personal circumstances are taken into consideration in developing your individual financial plan. Information contained in this article has been compiled from sources believed to be reliable, but no representation or warranty, express or implied, is made with respect to its timeliness or accuracy and SLGI Asset Management Inc. disclaims any responsibility for any loss that may arise as a result of the use of the strategies discussed.