
This article explores the current market dynamics, potential risks, and opportunities that make fixed income an attractive consideration for investors seeking to optimize their portfolios in the current environment.
Does it pay to stay invested when markets fall?
January 23, 2026
The stock market has constant ups and downs, but historically has returned to its previous high with time, even after bear markets.

Stock markets are in a constant state of flux moving up, down and sideways. They don’t go straight up, but historically they have trended higher, bouncing back from shorter-term declines.
When markets start to fall, our instincts often tell us to sell. But if you sell when the market falls, you will crystalize losses and you’ll likely miss out on any market rebound and associated gains - meaning you may fall short of your long-term investment goals.
In stock market downturns, many investors are relieved to be on the sidelines. If we look back at the chart below, illustrating the largest component of the stock market the S&P500, imagine what could have happened if you ignored the dramatic headlines and had simply stayed invested.
Stock Market
S&P 500 Index
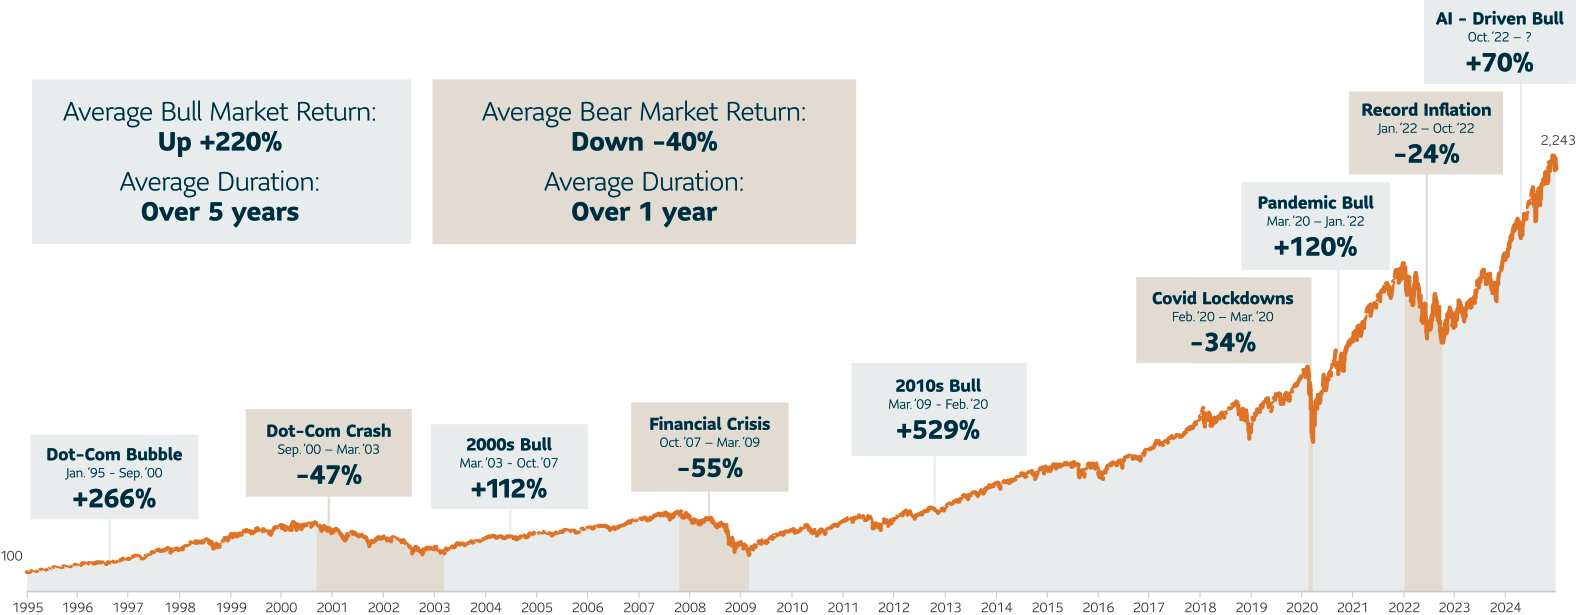
Stock market returns represented by the S&P 500 Index. Source: Morningstar.
This example is for illustrative purposes only and is not intended to be representative of the performance of any actual or future investment available to investors. It is not possible to invest directly in an index. Returns are calculated in U.S. dollars and assume reinvestment of all income and no transaction costs or taxes for the period January 1, 1995 to December 31, 2025. Actual returns would be different due to fees and expenses associated with investing which are not applicable to an index. For purposes of this illustration, a bear market is defined as an index falling at least 20% from a previous high.
Time in the market is time well-spent
Historically, bull markets have lasted 4 times longer than bears market and driven long-term gains. When markets start to fall, our instincts often tell us to sell now and buy again later. That may seem logical, but how do you pick the right time to exit or re-enter the market? Because rallies can sometimes come in surges measured in days not weeks, being out of the market for even a few days can mean missing out on gains.
Missing the best days can hurt
Growth of $10,000 in the S&P 500 Index, 31 years ending 12/31/25
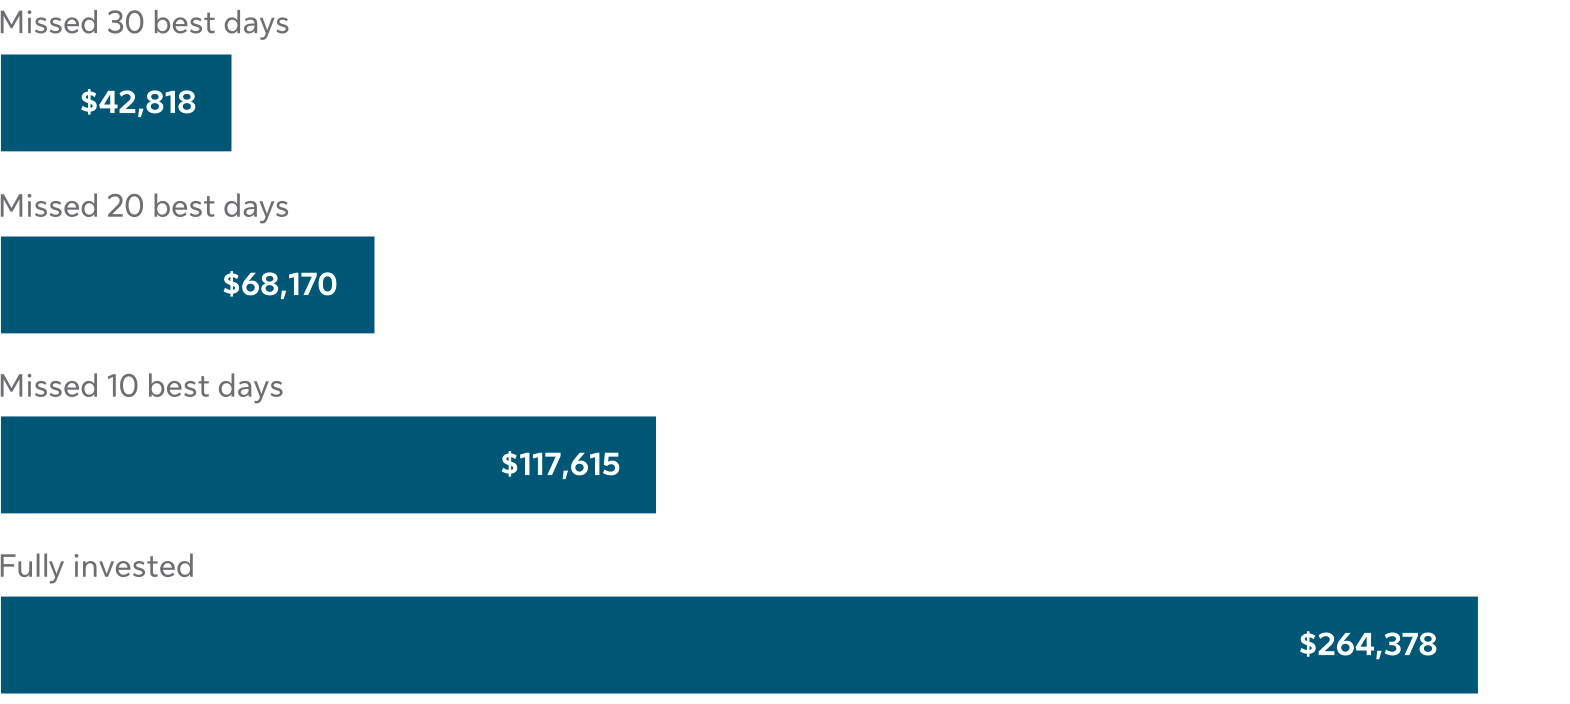
For illustrative purposes only. Returns have been rounded to the nearest whole number for simplicity. Past performance is no guarantee of future results. It is not possible to invest in an index. Actual returns would be different due to fees and expenses associated with investing which are not applicable to an index. Source: FactSet and S&P US. Daily data as of December 31, 2005 through December 31, 2025. Analysis ranks all daily returns for the index and assumes that investors that are not fully invested on the best days miss out on those returns. If index return the following day does not fall into a range that meets the definition of best days, then the growth of the hypothetical investment resumes.
When the markets fall, it pays to stay focused on your long-term investment goals.
For more information, speak to your advisor.
This content is provided for information and illustrative purposes only and is not intended to provide specific financial, tax, insurance, investment, legal or accounting advice and should not be relied upon in that regard and does not constitute a specific offer to buy and/or sell securities.
Information contained in this document has been compiled from sources believed to be reliable, but no representation or warranty, express or implied, is made with respect to its timeliness or accuracy.