Note: Due to January market volatility and key rate announcements, we have updated our Q4 commentary with additional market data to Jan. 26.
Additional links: CIO Chhad Aul speaks about market volatility
Article on understanding market volatility
Highlights
- After hitting record highs in Q4, markets declined in the new year: S&P 500 down 7.2%, NASDAQ down 11.4% and S&P/TSX Composite down 1.9% for the month to January 26.
- On Jan. 26, the U.S. Federal Reserve did not increase its benchmark rate but signalled it would “soon” be appropriate to raise rates. The Fed moved to end its QE program in March and signalled it was ready to reduce its balance sheet once rates begin to rise.
- On Jan. 26, the Bank of Canada kept its key target interest rate steady at 0.25%. The BOC governor Tiff Macklem stated that Canadians should expect a rising path for interest rates in order to control inflation.
- As of Jan. 26 benchmark oil prices moved higher to US$87.52-a-barrel, with uncertainty over the Russia/Ukraine border dispute.
- In Q4 into January, the Omicron variant continued to spread, slowing global economic growth, and clouding the earnings outlook.
How we view the selloff
- We anticipated increased volatility and moved to a neutral equity weighting last fall.
- Market corrections are a normal occurrence in a bull market, and by some measures this one was somewhat overdue.
- At this point in the market cycle we don’t expect a bear market to emerge.
- Worries about elevated inflation added fuel to the selloff. However, many of the indicators we watch suggest that certain drivers of inflation could moderate in the latter half of the year.
- Central banks may not be as aggressive as is priced into markets if inflation cools as the year progresses.
- We expect yields to slowly move higher as we move closer to rate increases.
- Speculative companies with high-price-to-sales multiples were hit the hardest in the correction.
- We prefer high-quality companies with sustainable earnings potential. These should potentially recover and could do well at this point in the earnings cycle.
To rescue the economy from COVID-19, in March 2020 the U.S. Federal Reserve unleashed a flood of liquidity by slashing interest rates to effectively zero. The market rallied to record highs. But the question of when the Fed would begin turning off the tap has hung over the market for months. In mid-December, investors finally got part of the answer when the Fed set the stage for rate increases by announcing that it would end its bond-buying program. Then, when the minutes of that meeting were released on January 4, the Fed confirmed it would tighten, possibly in three, quarter-point hikes this year. In response, the yield on U.S. ten-year Treasuries immediately spiked, triggering a selloff in the bond and equity markets, with high-multiple tech companies hit the hardest.
The Fed also appeared more aggressive when it indicated that after it ends its bond-buying program, it would begin to reduce the size of its balance sheet. It has grown from about US$4.5 trillion to over US$8 trillion through bond purchases during the pandemic. And reducing it could drain even more liquidity from the market.
With the S&P 500 more than doubling off its pandemic low, it remains to be seen how equity markets will adapt to this changing rate environment. So far, markets have been resilient. Indeed, despite the emergence and global spread of the Omicron variant of COVID-19, the S&P 500 was up 27% in 2021 – racking up double-digit returns for the third year in a row. Both the S&P 500 and the Dow also hit new highs on January 3, just prior to the release of the Fed minutes.
We expect increased market volatility as rates begin to rise. However, even if the Fed rate was at 1% by the end of 2022, that would still be quite low by historic standards. As well, for now with inflation running at close to 7%, real bond yields are deeply negative, with equity markets continuing to attract investors looking for an alternative.
Equity markets also continue to be supported by massive fiscal stimulus (estimated at US$20 trillion worldwide), including the recent passage of a US$1-trillion infrastructure bill. If President Joe Biden is also able to pass a version of his Build Back Better Act, it could add even more stimulus. In the meantime, the European Union is rolling out its €2.018-trillion European Recovery Plan.
Staying neutral in an uncertain market
Still, even with ongoing fiscal and monetary support there are reasons to be cautious. With a forward PE ratio of close to 29, the S&P 500 is trending well above its long-term average of 15.5. And with Omicron triggering economic lockdowns, it has the potential to slow the economy and dint earnings growth, which was estimated at nearly 22% for S&P 500 companies in Q4. It also remains to be seen how stubborn inflation will be and how aggressive the Fed will ultimately become in fighting it.
With that uncertainty in the market, we ended the quarter broadly neutral on equities in the Sun Life Granite Managed Solutions. However, we expect the economy to continue to recover throughout 2022 and have positioned the portfolios for a continued rotation into high-quality U.S. and global, value and cyclical stocks. As part of our value play, as we entered the New Year our largest equity overweight was in global mid-caps and small-caps. This should give us broad exposure if the global economy further recovers.
Energy and financials (a beneficiary of rising interest rates) were two of the top-performing sectors in Q4. To participate in that trade, we had an overweight exposure to financials. We have also owned the XLE in the past. We did not have a direct play on oil in Q4, which climbed from around US$20 a barrel in April 2020 to US$72 a barrel at the end of December 2021. However, we have exposure through the geographic weightings in specific underlying funds and the S&P/TSX Composite Index, which has a heavy weighting in energy.
Growth stocks led value stocks for most of the last 13 years, including in much of the market’s recovery off the 2020 bottom. In Q4, technology stocks (particularly those with high price-to-earnings ratios) sold off in anticipation of a more hawkish Fed. However, led by the so-called FAANG stocks, many quality names in the sector later rallied as investors sought stability in strong balance sheets. Hence, as a counter to our overweight in cyclicals and value stocks, we largely maintained our position (as we have throughout the market’s rally) in high-quality growth.
With U.S. equities continuing to push higher throughout Q4, we purchased out-of-the-money equity put options to hedge potential tail risks from an over-extended market and Omicron’s spread.
Fixed income: Prefer cash to government bonds
Despite the Fed’s decision to taper back its bond-buying program and looming interest rate increases, the yield on U.S. 10-year Treasuries ended the year at 1.52%, down from its March high of 1.74%, but still up 63% on the year. At the same time shorter term yields, which are more sensitive to expected central bank tightening, moved sharply higher as two-year Treasuries climbed from 0.11% to 0.73% on the year. However, in January, following the release of the minutes of the Fed’s December meeting, the yield on 10-year Treasuries surged above 1.7%, triggering a major bond selloff on the prospect of higher interest rates.
We believe yields could potentially grind higher still in 2022. Given this, we continued to be underweight duration-sensitive issues. We also remained overweight cash at year end and could eventually use some of that to increase our bond holdings if yields become more predictable.
Alternatively, we remained overweight credit with a focus on high quality corporate bonds. And within our weighting, we held a specific allocation to intermediate-term corporates.
Chart 1: High-yield bonds outperform
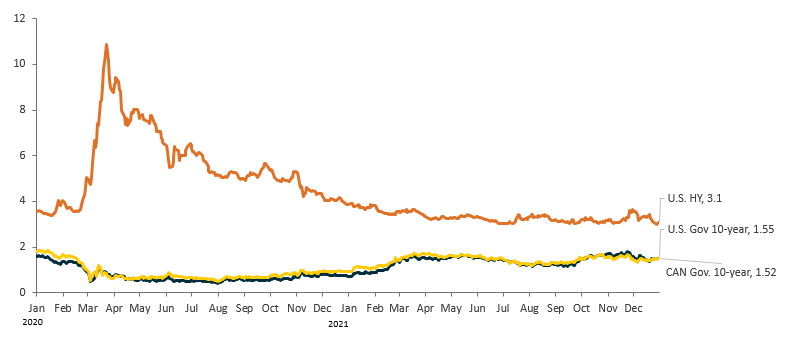
Source: Bloomberg. Data as of December 31, 2021. U.S. stocks: S&P 500; Canadian stocks: S&P/TSX Capped Composite Index; Emerging market stocks: MSCI Emerging Markets Index; International stocks: MSCI EAFE Index; Canadian bonds: FTSE Canada Universe Bond Index; U.S. bonds: Bloomberg Barclays U.S. Aggregate Bond Index; High yield bonds: Bloomberg Barclays Global High Yield Total Return Index.
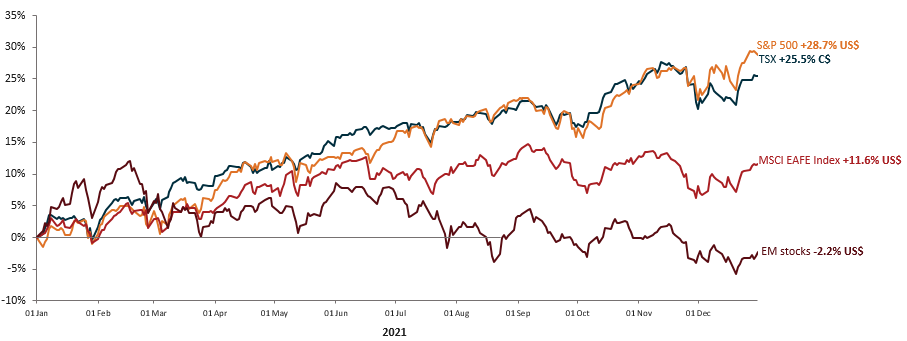
After a 17-month-long rally off the March 2020 bottom, most major equity indices were up on the year (Chart 2). The S&P 500 was up 28.7%, and the S&P/TSX Composite Index was up 25.5%, led by energy and financials (Chart 3). While we believe the S&P 500 could still move higher in 2022, as noted, we expect increased volatility in the months ahead.
Chart 2: Most major indexes post strong 2021 returns
After a strong run, neutral on the U.S.
With interest rate risks growing in the market, we maintained our neutral weighting on U.S. equities in Q4, down from a 1.3% overweight in Q1. However, we still believe the U.S. market is well positioned to benefit from the economic recovery. Indeed, the Conference Board forecasts that U.S. Real GDP growth will come in at 6.5% (annualized) in Q4, vs. 2.1% percent in Q3 and a projected 5.6% overall for 2021.
The strength of the U.S. economy is reflected in the earnings growth of S&P 500 companies, which is projected at around 22% for 2021. All 11 sectors of the index could report year-over-year growth in earnings, led by the energy, industrial, materials, consumer discretionary and financial sectors. Overall earnings have been bolstered by strong consumer demand and higher productivity as businesses reduced costs through the adoption of digital technology and automation.
Whether that earnings strength will continue in 2022 is open to question. For one, as noted, the Fed is expected to tighten. And the stimulative effect of the US$5.3 trillion in fiscal spending that Washington has pumped into the economy over the last two years, could begin to wane. On top of that, increasing wage costs and potentially higher corporate taxes could hamper earnings growth.
Canada: TSX poised to outperform again?
The Canadian economy continued to rebound in Q4, with employment levels reaching pre-pandemic levels. The housing sector remained robust, with home prices in some parts of the country hitting record levels. The country’s economic strength was also reflected in November’s $3 billion trade surplus, the largest in more than a decade. This resulted in part from the strong demand for commodities including oil, with Western Canadian Select reaching $65 a barrel on near-record production.
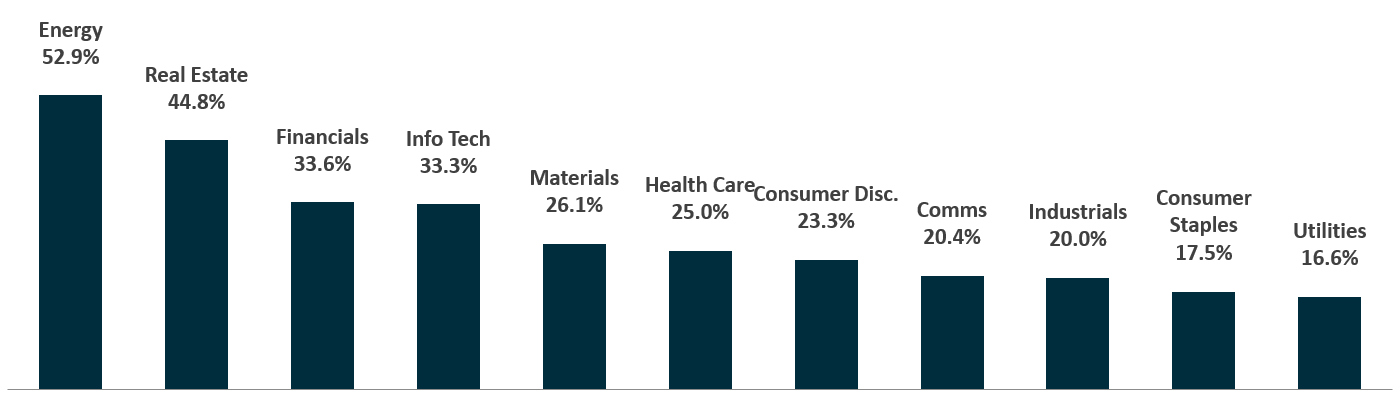
The S&P/TSX Composite Index was up 25% in 2021, led by energy and real estate. However, the index is heavily weighted in financials (30%) and energy and materials (25%). As well, there are idiosyncratic company risks, where the share price has run up dramatically in specific companies. With this lack of diversification, we remain neutral at this point.
Chart 3: Energy and real estate lead TSX higher
S&P/TSX sector returns YTD
Source: Bloomberg. Data as of December 31, 2021. Companies, securities, industries or market sectors named should not be considered an indication of trading intent of any mutual funds managed by SLGI Asset Management Inc. These views are not to be considered as investment advice nor should they be considered a recommendation to buy or sell.
Emerging markets: watching China’s economy
We also held to our neutral weighting in emerging markets. The economies of diverse emerging market (EM) countries, including the Czech Republic and United Arab Emirates, performed well in Q4. But to reduce risk, we have been selling calls on the overall EM group.
While vaccination rates have generally risen in EM countries, higher population densities in some regions have made the Omicron variant more difficult to control. Tighter monetary and fiscal policies in specific countries also dampened output in Q4. Growth could also be further challenged if the U.S. dollar strengthens as the Fed moves to increase interest rates.
China, with the largest weighting in our EM benchmark, saw its economy slow in Q4. To stimulate growth, the People's Bank of China cut its main interest rate in December to 3.8%. However, China’s zero Covid-19 policy, which has seen the lock down of major cities, has held back some sectors of the economy.
Moreover, policy uncertainly continues surrounding President Xi Jinping’s “common prosperity” initiative. It has erased more than $1 trillion in market value from some of the country’s leading technology companies. Hence, we are watching for further policy changes ahead of October's Communist Party Congress, where Xi may receive an unprecedented third term in office.
Europe: Omicron slows the economy
In terms of EAFE equites, we were slightly underweight international large-caps with exposure to Europe in Q4. While the European economy is expected to grow by 5% in 2021, it has been slowed by lockdowns as governments attempt to control the Omicron variant. As well, supply bottlenecks and high energy prices, which have jumped by 25%, have held back manufacturing production. In fact, the IHS Markit's Composite Purchasing Managers' Index, an indicator of overall economic health, dropped to 53.4 in December from 55.4 in November.
We are now closely watching for improvements in European markets, as the €2.018 trillion European Recovery Plan is rolled out.
Outlook: neutral overall on the markets
- Held to our neutral weighting in U.S. equities; maintained exposure to value and cyclicals.
- Continued to hold a neutral weighting on Canada.
- Slightly underweight EAFE equities on economic concerns.
- Maintained a neutral weighting in emerging market equites.
- Preferred cash over bonds with a slight overweight position in high yield corporate bonds.
What drove market activity in Q4, and what potential risks do we see ahead? Watch portfolio manager Christine Tan explain in our latest Market Update video.