
From 2009 to 2021, the S&P 500 Index1 had an incredible run. One negative year (in U.S. dollar terms2), and that was 2018, when it was down 4.4%. Because of currency changes, the index was up in Canadian dollar terms: + 4.2% (Note to readers: all returns and other amounts are in Canadian dollars for the rest of the article). And the 2019-2021 stretch featured several double-digit years. There have been volatile periods, including the steep market decline in March 2020 due to the global pandemic. But, as the U.S. federal government and the central bank provided economic stimulus, the market quickly returned to its upward path, finishing 2020 with a total return of 16.3%.
The point is, in recent memory, equity investors have generally benefitted from rising markets. So, mutual funds that have held equities (especially U.S. equities) have largely participated. It’s easy to forget about the investment basics during positive markets, and to ramp up one’s return expectations. When you look at industry fund flows, this is indeed what happened in first six months of 2021. Investors put $25.9 billion in equity funds, accounting for more than one-third of the industry’s $71.9 billion in net sales. By comparison, net flows into equity funds in the previous four years (2017, 2018, 2019 and 2020) were $4.4 billion, $4.6 billion, -$5.8 billion and $1.9 billion. This is not a comment on whether those were correct decisions, but to show that investor behaviour is inconsistent.
At the same time, fund flows show that many investors are following the time-tested practice of diversifying into balanced funds. These offer less growth potential than equity funds. But, because they invest in a mix of fixed income and equities, they may offer some protection when equity markets go down. Net flows into balanced funds staged a significant comeback in the first half of 2021, with $39.6 billion in net sales. And fixed income sales were also strong, at $9.3 billion.
But let’s move from types of investments to just focusing on the choice to invest or not. The graph shows monthly mutual fund net sales from January 2020 to May 2021. In March 2020, coinciding with the COVID stock market correction, we see a significant reversal of flows. As a percentage of overall assets, the amount was small: net industry redemptions of 0.9% of total assets. But the dollar amount is huge: $14 billion. This reversal shows that, even in an industry that sees a lot of inflows from monthly contributions, large numbers of people will either stop contributing, or redeem when they are afraid.
Mutual fund net sales (monthly, billion)
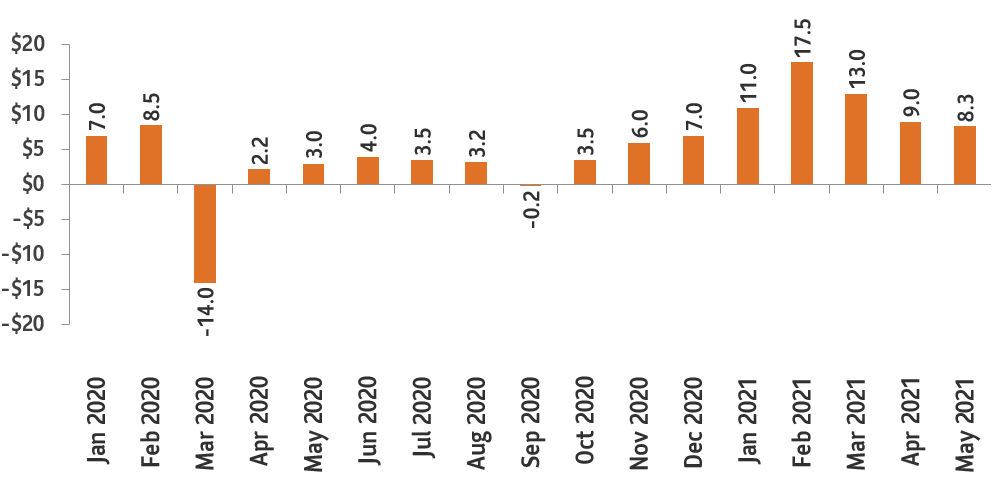
Source: IFIC industry statistics
This stimulus-response seems predictable – in hindsight. Markets had been healthy and then, suddenly, there was a huge, negative global event. This was a classic “bad economic news = bad market news” formula. The unpredictable part was what happened next. How would the disease progress? How long would it take for demand to recover? How would governments and central banks respond?
There are other times when market downturns (or volatile periods) seem to follow a “good economic news = bad market news” formula. For example, when governments and central bankers see that employment is rising and consumers are spending more, they may start to signal withdrawal of fiscal and monetary support. In summer 2021, the Federal Open Market Committee indicated that it would start reducing its bond purchases (i.e., they would “taper”)3. After a long period of support, this policy shift is good news in that it signals that the economy is performing well. But investors often see increased risk during policy transition periods.
For mutual fund investors, it’s important to remember that economic analysis can help people understand why things have happened. But, economists have a poor record of predicting what will happen in the short term4. If economic activity is difficult to predict, how accurate can short-term market predictions be? Markets are made up of people not only responding to macroeconomic and company-specific indicators, but also trying to predict how others will react. And humans, with their biases and emotions, are carrying out this complex activity.
One of the roles of financial advice is setting up guardrails for investors. Advisors are trained to get to know their Clients and set up portfolios that factor in market unpredictability. At times, portfolios will not match up perfectly with what the markets are delivering. But, when markets go through inevitable tough times, these guardrails may help keep you and your plan on course.
Related resources
- For a quick read on working with an advisor, start here
- Read about a fund that invests in U.S. equities
- Want to know the mutual fund basics? Start with this article about types of funds
- Learn more about a series of balanced funds that invest in a mix of fixed income and equities
- Looking for investment funds that have guarantees? Start here
Disclosure
Index performance is for illustrative purposes only and is not intended to be representative of the performance of any actual or future investment managed by Sun Life Global Investments. It is not possible to invest directly in an index. Returns are calculated in the currencies noted and assume reinvestment of all income and no transaction costs or taxes for the periods indicated. Actual returns would be different due to fees and expenses associated with investing which are not applicable to an index.
Commissions, trailing commissions, management fees and expenses may be associated with mutual fund investments. Please read the Fund’s prospectus before investing. Mutual funds are not guaranteed, their values change frequently as past performance may not be repeated.
This document is provided for information purposes only and is not intended to provide specific individual financial, investment, tax or legal advice. Views expressed regarding a particular company, security, industry or market sector should not be considered an indication of trading intent of any mutual funds managed by SLGI Asset Management Inc. or any of the sub-advisors to those funds. These views are not to be considered as investment advice nor should they be considered a recommendation to buy or sell.
Information contained in this document has been compiled from sources believed to be reliable, but no representation or warranty, express or implied, is made with respect to its timeliness or accuracy. This document may contain forward-looking statements about the economy, and markets; their future performance, strategies or prospects. Forward-looking statements are not guarantees of future performance and are speculative in nature and cannot be relied upon.
1Reader note: some of the examples in this article are U.S.-focused, as its equity markets are the world’s largest, and have influence in major markets around the globe. Index data is from Morningstar Direct.
2We used the index return in U.S. dollars here to show that the index did not have a perfect winning streak from 2009 on. After this, however, all index returns and other amounts are in Canadian dollars.
3“Markets have already started to adjust to the Fed’s expected policy tightening,” by Jeff Cox, CNBC, Aug. 18, 2021.
4“Why economic forecasting has always been a flawed science,” by Adam Shaw, The Guardian, Sept. 2, 2017. Shaw quotes the IMF’s Prakash Loungani’s study that showed economists had failed to predict 148 of the past 150 recessions.